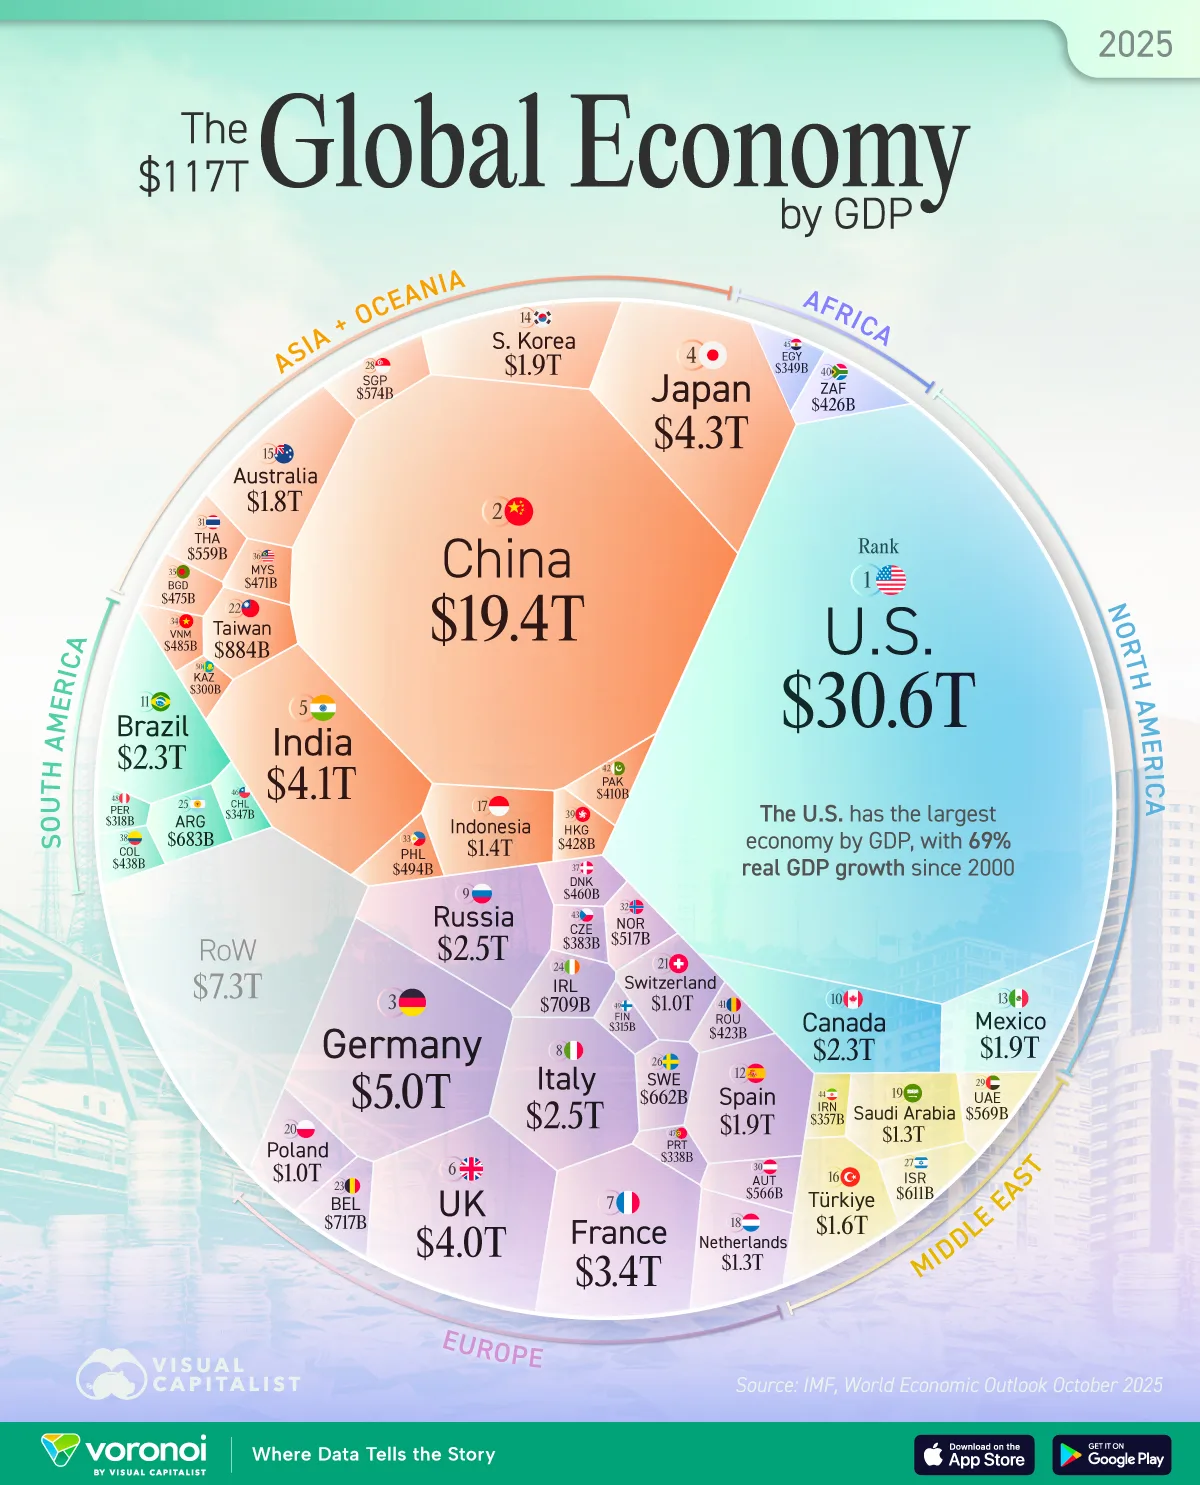
Visualizing the $117 Trillion World Economy in 2025
See visuals like this from many other data creators on our Voronoi app. Download it for free on iOS or Android and discover incredible data-driven charts from a variety of trusted sources.
Key Takeaways
- The U.S., China, and Germany are the top three countries by GDP in 2025.
- India ranks in fifth, averaging 6.4% in real GDP growth since 2000.
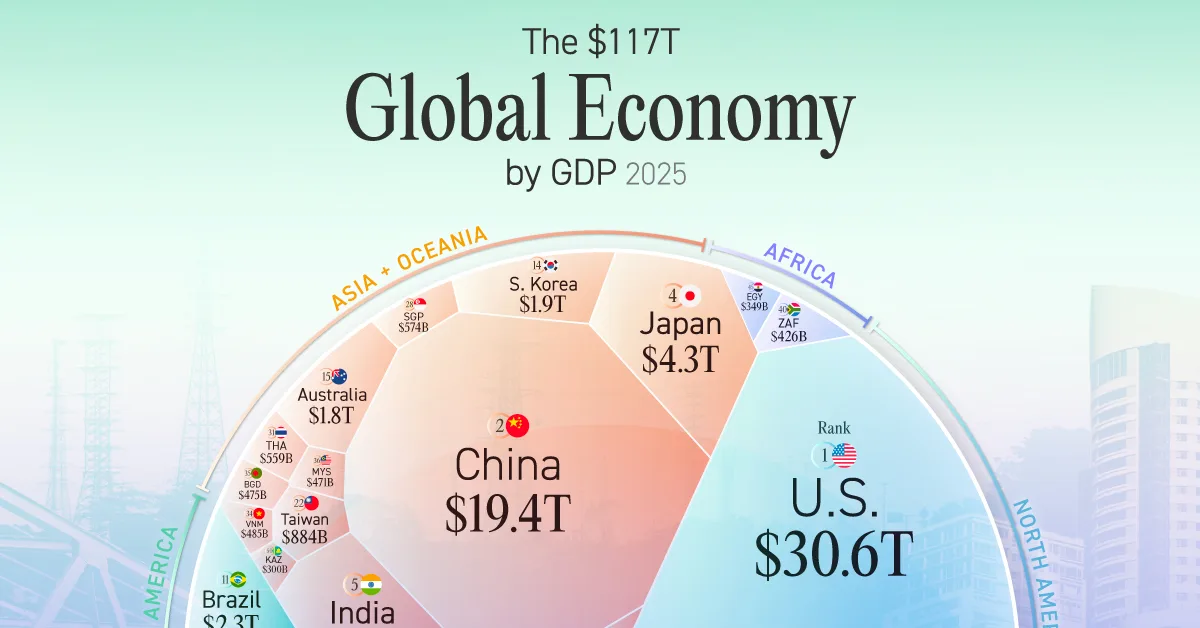
America’s $30.6 trillion economy is greater than China, Germany, and Japan combined, with real GDP set to rise 2% this year.
In comparison, India’s economy is projected to grow 6.6%, among the fastest rates across the world’s largest economies. It is only surpassed by Ireland, as frontloading of exports is expected to expand GDP by a striking 9.1% in 2025.
This graphic shows the state of the world economy in 2025, based on projections from the IMF’s latest World Economic Outlook.
Ranked: The Biggest Countries in the World Economy
Below, we rank the 50 largest economies globally, highlighting their historical growth trends:
| Rank | Country | GDP 2025 | Real GDP Growth |
2000-2025 Cumulative Real GDP Growth |
2000-2025 Average Annual Real GDP Growth |
|---|---|---|---|---|---|
| 1 |  U.S. U.S. |
$30.6T | 2.0% | 69.0% | 2.1% |
| 2 |  China China |
$19.4T | 4.8% | 585.7% | 8.0% |
| 3 |  Germany Germany |
$5.0T | 0.2% | 27.8% | 1.0% |
| 4 |  Japan Japan |
$4.3T | 1.1% | 16.6% | 0.6% |
| 5 |  India India |
$4.1T | 6.6% | 364.1% | 6.4% |
| 6 |  UK UK |
$4.0T | 1.3% | 44.6% | 1.5% |
| 7 |  France France |
$3.4T | 0.7% | 35.0% | 1.2% |
| 8 |  Italy Italy |
$2.5T | 0.5% | 9.8% | 0.4% |
| 9 |  Russia Russia |
$2.5T | 0.6% | 107.3% | 3.0% |
| 10 |  Canada Canada |
$2.3T | 1.2% | 59.4% | 1.9% |
| 11 |  Brazil Brazil |
$2.3T | 2.4% | 75.1% | 2.3% |
| 12 |  Spain Spain |
$1.9T | 2.9% | 50.6% | 1.7% |
| 13 |  Mexico Mexico |
$1.9T | 1.0% | 44.4% | 1.5% |
| 14 |  South Korea South Korea |
$1.9T | 0.9% | 131.3% | 3.4% |
| 15 |  Australia Australia |
$1.8T | 1.8% | 92.7% | 2.7% |
| 16 |  Türkiye Türkiye |
$1.6T | 3.5% | 228.3% | 5.0% |
| 17 |  Indonesia Indonesia |
$1.4T | 4.9% | 233.4% | 4.9% |
| 18 |  Netherlands Netherlands |
$1.3T | 1.4% | 43.9% | 1.5% |
| 19 |  Saudi Arabia Saudi Arabia |
$1.3T | 4.0% | 154.1% | 3.9% |
| 20 |  Poland Poland |
$1.0T | 3.2% | 138.5% | 3.6% |
| 21 |  Switzerland Switzerland |
$1.0T | 0.9% | 54.9% | 1.8% |
| 22 |  Taiwan Taiwan |
$884B | 3.7% | 144.2% | 3.7% |
| 23 |  Belgium Belgium |
$717B | 1.1% | 46.4% | 1.6% |
| 24 |  Ireland Ireland |
$709B | 9.1% | 243.3% | 5.2% |
| 25 |  Argentina Argentina |
$683B | 4.5% | 54.2% | 1.9% |
| 26 |  Sweden Sweden |
$662B | 0.7% | 56.8% | 1.8% |
| 27 |  Israel Israel |
$611B | 2.5% | 132.1% | 3.5% |
| 28 |  Singapore Singapore |
$574B | 2.2% | 196.8% | 4.5% |
| 29 |  UAE UAE |
$569B | 4.8% | 155.9% | 3.9% |
| 30 |  Austria Austria |
$566B | 0.3% | 36.0% | 1.3% |
| 31 |  Thailand Thailand |
$559B | 2.0% | 116.2% | 3.2% |
| 32 |  Norway Norway |
$517B | 1.2% | 47.5% | 1.6% |
| 33 |  Philippines Philippines |
$494B | 5.4% | 234.5% | 5.0% |
| 34 |  Vietnam Vietnam |
$485B | 6.5% | 372.0% | 6.4% |
| 35 |  Bangladesh Bangladesh |
$475B | 3.8% | 318.5% | 5.9% |
| 36 |  Malaysia Malaysia |
$471B | 4.5% | 196.2% | 4.5% |
| 37 |  Denmark Denmark |
$460B | 1.8% | 40.8% | 1.4% |
| 38 |  Colombia Colombia |
$438B | 2.5% | 135.8% | 3.5% |
| 39 |  Hong Kong SAR Hong Kong SAR |
$428B | 2.4% | 92.2% | 2.7% |
| 40 |  South Africa South Africa |
$426B | 1.1% | 67.2% | 2.1% |
| 41 |  Romania Romania |
$423B | 1.0% | 134.4% | 3.5% |
| 42 |  Pakistan Pakistan |
$410B | 2.7% | 158.7% | 3.9% |
| 43 |  Czechia Czechia |
$383B | 2.3% | 77.0% | 2.4% |
| 44 |  Iran Iran |
$357B | 0.6% | 110.2% | 3.1% |
| 45 |  Egypt Egypt |
$349B | 4.3% | 185.5% | 4.3% |
| 46 |  Chile Chile |
$347B | 2.5% | 125.5% | 3.4% |
| 47 |  Portugal Portugal |
$338B | 1.9% | 26.3% | 1.0% |
| 48 |  Peru Peru |
$318B | 2.9% | 170.7% | 4.2% |
| 49 |  Finland Finland |
$315B | 0.5% | 30.4% | 1.1% |
| 50 |  Kazakhstan Kazakhstan |
$300B | 5.9% | 288.2% | 5.6% |
As we can see, the U.S. economy has grown nearly 70% in the past quarter-century, in inflation-adjusted terms. On an annual basis, the average growth rate was 2.1%, the third-fastest across the 10 largest economies today.
For perspective, India has grown at more than triple this rate over the last 25 years, helping grow its GDP to $4.1 trillion. By next year, it is forecast to surpass Japan as the fourth-biggest economy.
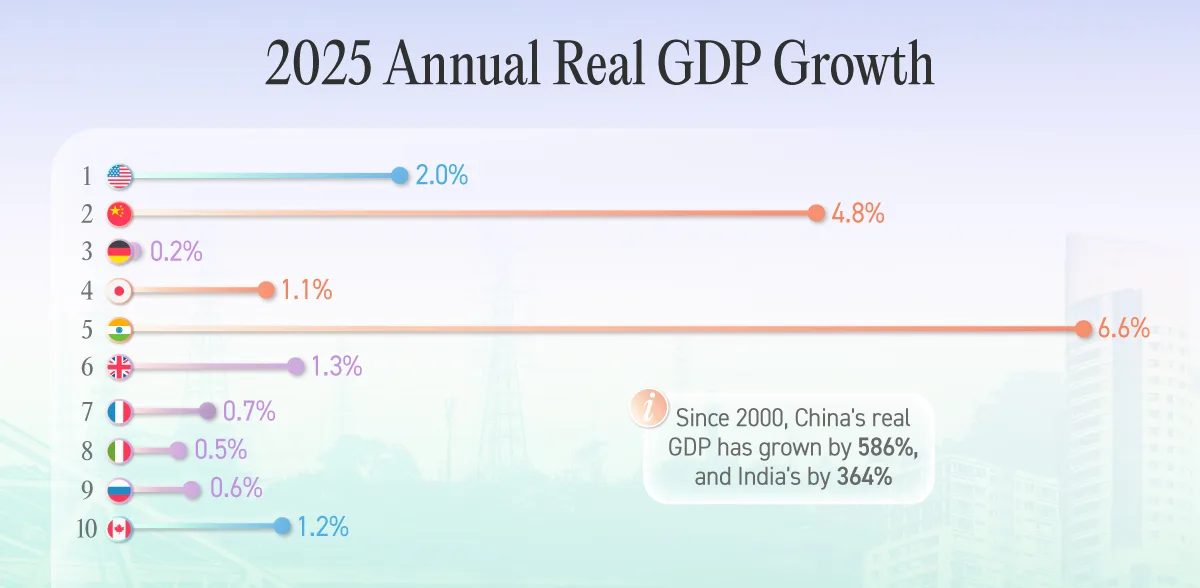
Germany, on the other hand, has seen notably sluggish growth for decades. In both 2023 and 2024, the economy contracted, while growth is expected to be just 0.2% this year. Along with weak productivity growth, its manufacturing sector has been in decline since 2018.
Similarly many European countries have averaged less than 2% growth over the last 25 years. Italy, the eighth-biggest economy, has averaged just 0.4% GDP growth, while in France, it has been just 1.2%.
Learn More on the Voronoi App 
To learn more about this topic, check out this graphic on the U.S. states with the fastest GDP growth since 1998.