The Fertility Rate of Every Country in the World
See visuals like this from many other data creators on our Voronoi app. Download it for free on iOS or Android and discover incredible data-driven charts from a variety of trusted sources.
Key Takeaways
- About 71% of the world’s population now lives in countries with birth rates below the replacement level needed to maintain population size.
- China’s fertility rate has fallen to just 1.0 births per woman, while India has also dropped below replacement level at 1.9.
- Sub-Saharan Africa has the world’s highest fertility rates, led by Chad, Somalia, and DR Congo.
Fertility rates are falling across much of the world, dropping from roughly five births per woman in the 1960s to a global average of 2.2 in 2024. The shift is reshaping long-term population growth, economic outlooks, and age demographics worldwide.
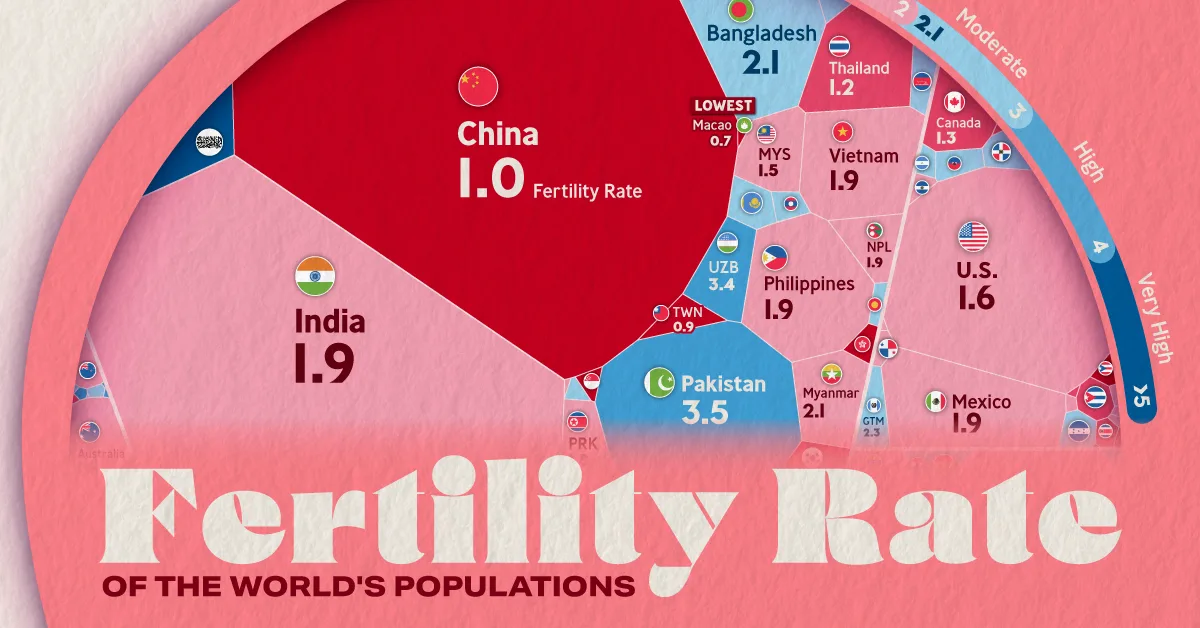
This visualization shows the fertility rate of every country and territory alongside its population size. Each segment is sized by population and shaded by fertility rate, revealing where birth rates remain high and where populations are aging rapidly.
The data comes from the United Nations World Population Prospects 2024 Revision, using 2025 medium-variant estimates for both population and fertility.
Most of the World Is Below Replacement Fertility
About 71% of the global population lives in countries or territories with fertility rates below the replacement level of 2.1 births per woman.
Replacement fertility refers to the birth rate needed for a population to maintain its size over time without immigration. Falling below that threshold for long periods can lead to aging populations, labor shortages, and slower economic growth.
Central to this global shift are India and China, the world’s two most populous countries.
The data table below shows population and fertility rates across 236 countries and territories.
| Country | Population (thousands) | Total Fertility Rate (TFR) |
|---|---|---|
 India India |
1,460,000 | 1.94 |
 China China |
1,420,000 | 1.02 |
 United States United States |
347,300 | 1.62 |
 Indonesia Indonesia |
285,700 | 2.10 |
 Pakistan Pakistan |
255,200 | 3.50 |
 Nigeria Nigeria |
237,500 | 4.30 |
 Brazil Brazil |
212,800 | 1.60 |
 Bangladesh Bangladesh |
175,700 | 2.11 |
 Russia Russia |
144,000 | 1.46 |
 Ethiopia Ethiopia |
135,500 | 3.81 |
 Mexico Mexico |
131,900 | 1.87 |
 Japan Japan |
123,100 | 1.23 |
 Egypt Egypt |
118,400 | 2.71 |
 Philippines Philippines |
116,800 | 1.88 |
 DR Congo DR Congo |
112,800 | 5.90 |
 Vietnam Vietnam |
101,600 | 1.88 |
 Iran Iran |
92,400 | 1.67 |
 Turkey Turkey |
87,700 | 1.62 |
 Germany Germany |
84,100 | 1.46 |
 Thailand Thailand |
71,600 | 1.19 |
 Tanzania Tanzania |
70,500 | 4.47 |
 United Kingdom United Kingdom |
69,500 | 1.54 |
 France France |
66,700 | 1.64 |
 South Africa South Africa |
64,800 | 2.19 |
 Italy Italy |
59,100 | 1.21 |
 Kenya Kenya |
57,500 | 3.12 |
 Myanmar Myanmar |
54,900 | 2.08 |
 Colombia Colombia |
53,400 | 1.62 |
 South Korea South Korea |
51,700 | 0.75 |
 Sudan Sudan |
51,700 | 4.19 |
 Uganda Uganda |
51,400 | 4.06 |
 Spain Spain |
47,900 | 1.23 |
 Algeria Algeria |
47,400 | 2.67 |
 Iraq Iraq |
47,000 | 3.17 |
 Argentina Argentina |
45,900 | 1.50 |
 Afghanistan Afghanistan |
43,800 | 4.66 |
 Yemen Yemen |
41,800 | 4.41 |
 Canada Canada |
40,100 | 1.33 |
 Angola Angola |
39,000 | 4.95 |
 Ukraine Ukraine |
39,000 | 1.00 |
 Morocco Morocco |
38,400 | 2.18 |
 Poland Poland |
38,100 | 1.31 |
 Uzbekistan Uzbekistan |
37,000 | 3.45 |
 Malaysia Malaysia |
36,000 | 1.53 |
 Mozambique Mozambique |
35,600 | 4.62 |
 Ghana Ghana |
35,100 | 3.30 |
 Peru Peru |
34,600 | 1.94 |
 Saudi Arabia Saudi Arabia |
34,600 | 2.29 |
 Madagascar Madagascar |
32,700 | 3.84 |
 Ivory Coast Ivory Coast |
32,700 | 4.17 |
 Cameroon Cameroon |
29,900 | 4.19 |
 Nepal Nepal |
29,600 | 1.94 |
 Venezuela Venezuela |
28,500 | 2.06 |
 Niger Niger |
27,900 | 5.79 |
 Australia Australia |
27,000 | 1.64 |
 Dem. People’s Republic of Korea Dem. People’s Republic of Korea |
26,600 | 1.77 |
 Syria Syria |
25,600 | 2.66 |
 Mali Mali |
25,200 | 5.42 |
 Burkina Faso Burkina Faso |
24,100 | 4.00 |
 Sri Lanka Sri Lanka |
23,200 | 1.94 |
 Taiwan Taiwan |
23,100 | 0.86 |
 Malawi Malawi |
22,200 | 3.53 |
 Zambia Zambia |
21,900 | 3.97 |
 Chad Chad |
21,000 | 5.94 |
 Kazakhstan Kazakhstan |
20,800 | 2.95 |
 Chile Chile |
19,900 | 1.13 |
 Somalia Somalia |
19,600 | 5.91 |
 Senegal Senegal |
18,900 | 3.71 |
 Romania Romania |
18,900 | 1.71 |
 Guatemala Guatemala |
18,700 | 2.26 |
 Netherlands Netherlands |
18,400 | 1.44 |
 Ecuador Ecuador |
18,300 | 1.79 |
 Cambodia Cambodia |
17,900 | 2.51 |
 Zimbabwe Zimbabwe |
16,900 | 3.62 |
 Guinea Guinea |
15,100 | 4.04 |
 Benin Benin |
14,800 | 4.42 |
 Rwanda Rwanda |
14,600 | 3.59 |
 Burundi Burundi |
14,400 | 4.68 |
 Bolivia Bolivia |
12,600 | 2.50 |
 Tunisia Tunisia |
12,300 | 1.80 |
 South Sudan South Sudan |
12,200 | 3.71 |
 Haiti Haiti |
11,900 | 2.59 |
 Belgium Belgium |
11,800 | 1.39 |
 Jordan Jordan |
11,500 | 2.57 |
 Dominican Republic Dominican Republic |
11,500 | 2.19 |
 United Arab Emirates United Arab Emirates |
11,300 | 1.21 |
 Honduras Honduras |
11,000 | 2.45 |
 Cuba Cuba |
10,900 | 1.45 |
 Tajikistan Tajikistan |
10,800 | 2.99 |
 Papua New Guinea Papua New Guinea |
10,800 | 3.03 |
 Sweden Sweden |
10,700 | 1.44 |
 Czechia Czechia |
10,600 | 1.47 |
 Portugal Portugal |
10,400 | 1.52 |
 Azerbaijan Azerbaijan |
10,400 | 1.66 |
 Greece Greece |
9,900 | 1.34 |
 Togo Togo |
9,700 | 4.07 |
 Hungary Hungary |
9,600 | 1.50 |
 Israel Israel |
9,500 | 2.75 |
 Austria Austria |
9,100 | 1.33 |
 Belarus Belarus |
9,000 | 1.22 |
 Switzerland Switzerland |
9,000 | 1.44 |
 Sierra Leone Sierra Leone |
8,800 | 3.61 |
 Laos Laos |
7,900 | 2.36 |
 Turkmenistan Turkmenistan |
7,600 | 2.63 |
 Libya Libya |
7,500 | 2.25 |
 Hong Kong Hong Kong |
7,400 | 0.74 |
 Kyrgyzstan Kyrgyzstan |
7,300 | 2.75 |
 Paraguay Paraguay |
7,000 | 2.39 |
 Nicaragua Nicaragua |
7,000 | 2.18 |
 Bulgaria Bulgaria |
6,700 | 1.74 |
 Serbia Serbia |
6,700 | 1.50 |
 Congo Congo |
6,500 | 4.05 |
 El Salvador El Salvador |
6,400 | 1.75 |
 Denmark Denmark |
6,000 | 1.52 |
 Singapore Singapore |
5,900 | 0.96 |
 Lebanon Lebanon |
5,800 | 2.21 |
 Liberia Liberia |
5,700 | 3.79 |
 Finland Finland |
5,600 | 1.30 |
 Norway Norway |
5,600 | 1.42 |
 Palestine Palestine |
5,600 | 3.19 |
 Central African Republic Central African Republic |
5,500 | 5.81 |
 Oman Oman |
5,500 | 2.48 |
 Slovakia Slovakia |
5,500 | 1.57 |
 Mauritania Mauritania |
5,300 | 4.56 |
 Ireland Ireland |
5,300 | 1.60 |
 New Zealand New Zealand |
5,200 | 1.65 |
 Costa Rica Costa Rica |
5,200 | 1.31 |
 Kuwait Kuwait |
5,000 | 1.50 |
 Panama Panama |
4,600 | 2.09 |
 Croatia Croatia |
3,900 | 1.47 |
 Georgia Georgia |
3,800 | 1.79 |
 Eritrea Eritrea |
3,600 | 3.61 |
 Mongolia Mongolia |
3,500 | 2.58 |
 Uruguay Uruguay |
3,400 | 1.39 |
 Puerto Rico Puerto Rico |
3,200 | 0.94 |
 Bosnia and Herzegovina Bosnia and Herzegovina |
3,100 | 1.50 |
 Qatar Qatar |
3,100 | 1.70 |
 Namibia Namibia |
3,100 | 3.17 |
 Moldova Moldova |
3,000 | 1.72 |
 Armenia Armenia |
3,000 | 1.71 |
 Jamaica Jamaica |
2,800 | 1.34 |
 Lithuania Lithuania |
2,800 | 1.22 |
 Gambia Gambia |
2,800 | 3.80 |
 Albania Albania |
2,800 | 1.33 |
 Gabon Gabon |
2,600 | 3.54 |
 Botswana Botswana |
2,600 | 2.66 |
 Lesotho Lesotho |
2,400 | 2.64 |
 Guinea-Bissau Guinea-Bissau |
2,200 | 3.68 |
 Slovenia Slovenia |
2,100 | 1.58 |
 Equatorial Guinea Equatorial Guinea |
1,900 | 4.04 |
 Latvia Latvia |
1,900 | 1.35 |
 North Macedonia North Macedonia |
1,800 | 1.47 |
 Kosovo (under UNSC res. 1244) Kosovo (under UNSC res. 1244) |
1,700 | 1.53 |
 Bahrain Bahrain |
1,600 | 1.78 |
 Trinidad and Tobago Trinidad and Tobago |
1,500 | 1.52 |
 Timor-Leste Timor-Leste |
1,400 | 2.56 |
 Cyprus Cyprus |
1,400 | 1.37 |
 Estonia Estonia |
1,300 | 1.37 |
 Mauritius Mauritius |
1,300 | 1.21 |
 Eswatini Eswatini |
1,300 | 2.68 |
 Djibouti Djibouti |
1,200 | 2.58 |
 Fiji Fiji |
930 | 2.25 |
 Comoros Comoros |
880 | 3.76 |
 Réunion Réunion |
880 | 2.13 |
 Solomon Islands Solomon Islands |
840 | 3.47 |
 Guyana Guyana |
840 | 2.37 |
 Bhutan Bhutan |
800 | 1.44 |
 Macao Macao |
720 | 0.69 |
 Luxembourg Luxembourg |
680 | 1.40 |
 Suriname Suriname |
640 | 2.21 |
 Montenegro Montenegro |
630 | 1.80 |
 Western Sahara Western Sahara |
600 | 2.15 |
 Malta Malta |
550 | 1.11 |
 Maldives Maldives |
530 | 1.55 |
 Cape Verde Cape Verde |
530 | 1.50 |
 Brunei Brunei |
470 | 1.71 |
 Belize Belize |
420 | 2.01 |
 Bahamas Bahamas |
400 | 1.36 |
 Iceland Iceland |
400 | 1.50 |
 Guadeloupe Guadeloupe |
370 | 2.05 |
 Martinique Martinique |
340 | 1.97 |
 Mayotte Mayotte |
340 | 4.50 |
 Vanuatu Vanuatu |
340 | 3.53 |
 French Guiana French Guiana |
310 | 3.29 |
 New Caledonia New Caledonia |
300 | 1.95 |
 Barbados Barbados |
280 | 1.70 |
 French Polynesia French Polynesia |
280 | 1.48 |
 Sao Tome and Principe Sao Tome and Principe |
240 | 3.53 |
 Samoa Samoa |
220 | 3.75 |
 Curacao Curacao |
190 | 1.07 |
 St. Lucia St. Lucia |
180 | 1.38 |
 Guam Guam |
170 | 2.71 |
 Kiribati Kiribati |
140 | 3.09 |
 Seychelles Seychelles |
130 | 2.08 |
 Grenada Grenada |
120 | 1.46 |
 Micronesia Micronesia |
110 | 2.71 |
 Aruba Aruba |
110 | 1.61 |
 Jersey Jersey |
100 | 1.38 |
 Tonga Tonga |
100 | 3.07 |
 St. Vincent & Grenadines St. Vincent & Grenadines |
100 | 1.75 |
 Antigua and Barbuda Antigua and Barbuda |
90 | 1.58 |
 United States Virgin Islands United States Virgin Islands |
80 | 2.07 |
 Isle of Man Isle of Man |
80 | 1.53 |
 Andorra Andorra |
80 | 1.10 |
 Cayman Islands Cayman Islands |
80 | 1.51 |
 Dominica Dominica |
70 | 1.47 |
 Bermuda Bermuda |
60 | 1.41 |
 Guernsey Guernsey |
60 | 1.37 |
 Faroe Islands Faroe Islands |
60 | 2.20 |
 Greenland Greenland |
60 | 1.91 |
 St. Kitts & Nevis St. Kitts & Nevis |
50 | 1.51 |
 Turks and Caicos Islands Turks and Caicos Islands |
50 | 1.44 |
 American Samoa American Samoa |
50 | 2.25 |
 Sint Maarten Sint Maarten |
40 | 1.43 |
 Northern Mariana Islands Northern Mariana Islands |
40 | 2.28 |
 Liechtenstein Liechtenstein |
40 | 1.54 |
 Gibraltar Gibraltar |
40 | 1.88 |
 British Virgin Islands British Virgin Islands |
40 | 1.06 |
 Monaco Monaco |
40 | 2.09 |
 Marshall Islands Marshall Islands |
40 | 2.82 |
 San Marino San Marino |
30 | 1.16 |
 Bonaire Bonaire |
30 | 1.45 |
 Saint Martin (French part) Saint Martin (French part) |
20 | 2.63 |
 Palau Palau |
20 | 1.86 |
 Anguilla Anguilla |
10 | 1.35 |
 Cook Islands Cook Islands |
10 | 2.00 |
 Nauru Nauru |
10 | 3.25 |
 St. Barthélemy St. Barthélemy |
10 | 0.83 |
 Wallis & Futuna Wallis & Futuna |
10 | 1.40 |
 Tuvalu Tuvalu |
10 | 3.14 |
 Saint Pierre and Miquelon Saint Pierre and Miquelon |
10 | 1.28 |
 St. Helena St. Helena |
10 | 1.64 |
 Montserrat Montserrat |
0 | 1.45 |
 Falkland Islands Falkland Islands |
0 | 1.69 |
 Tokelau Tokelau |
0 | 2.57 |
 Niue Niue |
0 | 2.46 |
India’s fertility rate sits at 1.94, while China’s is much lower at 1.02 due in part to its one-child policy, which was enforced from 1980–2015. Despite policy reversals and birth subsidies, no country that experienced a fertility decline as steep as China’s has fully recovered.
Fertility Trends Divided Among the Largest Populations
Among the world’s 10 largest populations, six are below replacement fertility. Alongside India and China, the U.S., Indonesia, Brazil, and Russia all fall below 2.1 births per woman.
Conversely, several of the world’s most populous countries remain well above replacement. Pakistan has a fertility rate of 3.50, Nigeria sits at 4.30, and Ethiopia at 3.81.
Future global population growth is increasingly concentrated in a smaller number of high-fertility countries, particularly across Sub-Saharan Africa and parts of South Asia.
Sub-Saharan Africa Has the World’s Highest Fertility
Overall, the highest fertility rates in the dataset are found in Sub-Saharan Africa, where the population-weighted fertility rate is about four. Chad (5.94 births per woman), Somalia (5.91), and DR Congo (5.90) recorded the region’s highest fertility rates in 2025.
Sub-Saharan Africa is expected to drive most of the world’s net population growth through 2100, with Nigeria alone projected to surpass the U.S. in population before 2050.
These countries stand in sharp contrast to places with very low fertility. Macao has the lowest fertility rate in the dataset at 0.69, followed by Hong Kong at 0.74 and South Korea at 0.75.
The gap between the world’s highest- and lowest-fertility countries is now historically wide, highlighting how uneven demographic change has become across regions.
Learn More on the Voronoi App 
If you enjoyed today’s post, check out Comparing Fertility Rates Across the Western World on Voronoi.Use This Visualization