 See more visuals like this on the Voronoi app.
Which U.S. States Have the Most Vehicles Per 1,000 People?
Key Takeaways
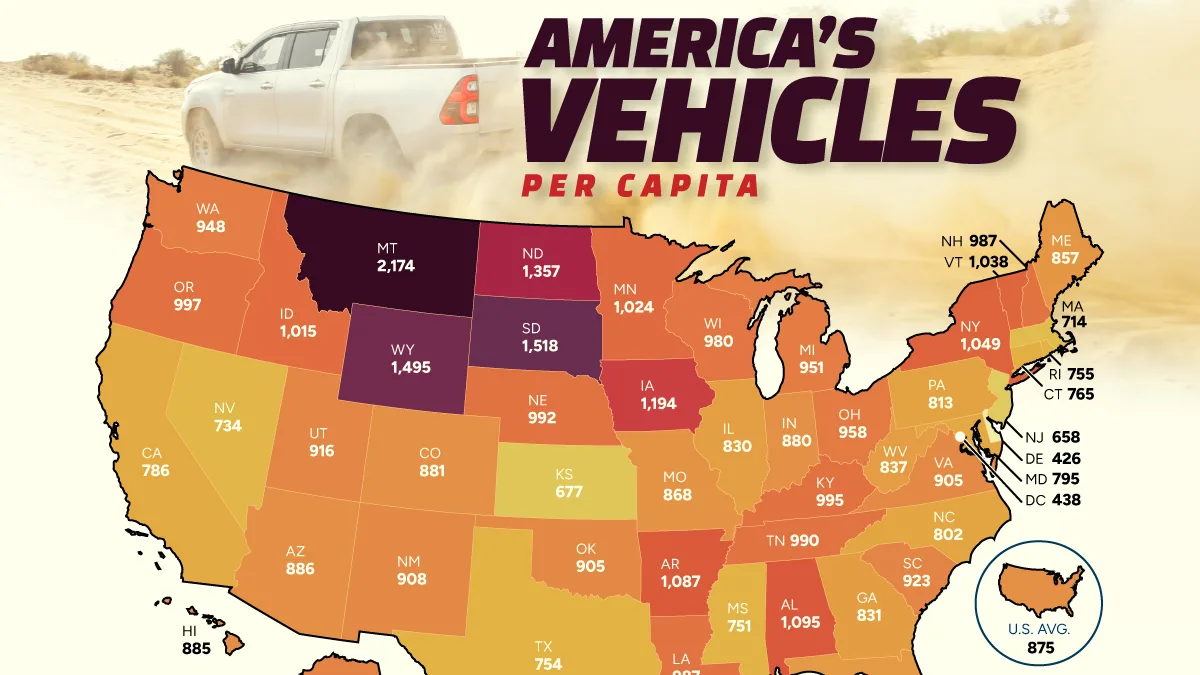
- Montana has 2,174 registered vehicles per 1,000 residents, making it the only state with more than two vehicles per person.
- Great Plains states dominate the top of the ranking, with South Dakota, Wyoming, and North Dakota all above 1,300 vehicles per 1,000 people.
- The U.S. averages 875 registered highway vehicles per 1,000 people, according to 2024 federal data.
Americans have nearly 298 million registered highway vehicles, but some states have far more vehicles than residents, while others have fewer than one vehicle for every person.
This map highlights the number of registered highway vehicles in each state per 1,000 people, using official 2024 highway data sourced from the Bureau of Transportation Statistics.
The differences reflect a mix of population density, commercial fleet registrations, and the types of vehicles counted in federal registration data.
Montana: More Than Two Cars Per Person
Montana is the nation’s biggest outlier, with 2,174 registered highway vehicles per 1,000 residents. In total, the state recorded nearly 2.5 million vehicles in 2024, despite having a population of just 1.1 million people.
The following data table lists states by their per-capita vehicle rates in 2024.
| Rank | State | Vehicles Per 1,000 People |
|---|---|---|
| 1 | Montana | 2,174 |
| 2 | South Dakota | 1,518 |
| 3 | Wyoming | 1,495 |
| 4 | North Dakota | 1,357 |
| 5 | Iowa | 1,194 |
| 6 | Alabama | 1,095 |
| 7 | Arkansas | 1,087 |
| 8 | New York | 1,049 |
| 9 | Vermont | 1,038 |
| 10 | Minnesota | 1,024 |
| 11 | Idaho | 1,015 |
| 12 | Oregon | 997 |
| 13 | Kentucky | 995 |
| 14 | Nebraska | 992 |
| 15 | Tennessee | 990 |
| 16 | Louisiana | 987 |
| 17 | New Hampshire | 987 |
| 18 | Wisconsin | 980 |
| 19 | Ohio | 958 |
| 20 | Michigan | 951 |
| 21 | Washington | 948 |
| 22 | Alaska | 927 |
| 23 | South Carolina | 923 |
| 24 | Utah | 916 |
| 25 | New Mexico | 908 |
| 26 | Virginia | 905 |
| 27 | Oklahoma | 905 |
| 28 | Arizona | 886 |
| 29 | Hawaii | 885 |
| 30 | Colorado | 881 |
| 31 | Indiana | 880 |
| 32 | United States | 875 |
| 33 | Missouri | 868 |
| 34 | Maine | 857 |
| 35 | Florida | 847 |
| 36 | West Virginia | 837 |
| 37 | Georgia | 831 |
| 38 | Illinois | 830 |
| 39 | Pennsylvania | 813 |
| 40 | North Carolina | 802 |
| 41 | Maryland | 795 |
| 42 | California | 786 |
| 43 | Connecticut | 765 |
| 44 | Rhode Island | 755 |
| 45 | Texas | 754 |
| 46 | Mississippi | 751 |
| 47 | Nevada | 734 |
| 48 | Massachusetts | 714 |
| 49 | Kansas | 677 |
| 50 | New Jersey | 658 |
| 51 | District of Columbia | 438 |
| 52 | Delaware | 426 |
Montanans do not necessarily have two to three vehicles apiece. Instead, several factors help explain how the state became such an outlier.
For one, a lack of sales tax makes the state attractive to many businesses registering commercial vehicle fleets, including businesses from outside Montana. This is especially relevant given the state’s large trucking, logging, mining, and agricultural sectors. Notably, over 60% of the vehicles on Montana’s highways are trucks.
There’s also the trailer component: livestock, RV, and utility trailers are all counted as vehicles under Federal Highway Administration (FHWA) registration. Montana had nearly as many trailers on its highways in 2024 as passenger cars.
The Great Plains and the City
Part of the Montana story is also a broader regional divide between larger, more rural states in the country’s interior and more densely populated coastal states.
States like North Dakota (1,357) and South Dakota (1,518) are characterized by smaller towns separated by longer distances, making driving, especially on highways, a practical necessity. This pattern appears across the Great Plains, including in Montana, Iowa (1,194), and Wyoming (1,495).
On the other end of the spectrum are denser, more urbanized states where people have more transportation options. For example, the Northeast corridor links cities like Boston, Baltimore, and Philadelphia through passenger rail and other transit options, reducing the need for household vehicle ownership. The same applies in New York (1,049), where car ownership costs are high in the country’s largest city, as well as in Washington, D.C. (438).
Delaware (426), a small and heavily urbanized state, has the lowest per-capita vehicle rate in the country.
Learn More on the Voronoi App
What’s the carbon footprint of some of this trucking traffic? Learn more with Road transport makes up most of the carbon footprint of food miles on Voronoi.