Mapped: Natural Resource Income as a Share of GDP
See visuals like this from many other data creators on our Voronoi app. Download it for free on iOS or Android and discover incredible data-driven charts from a variety of trusted sources.
Key Takeaways
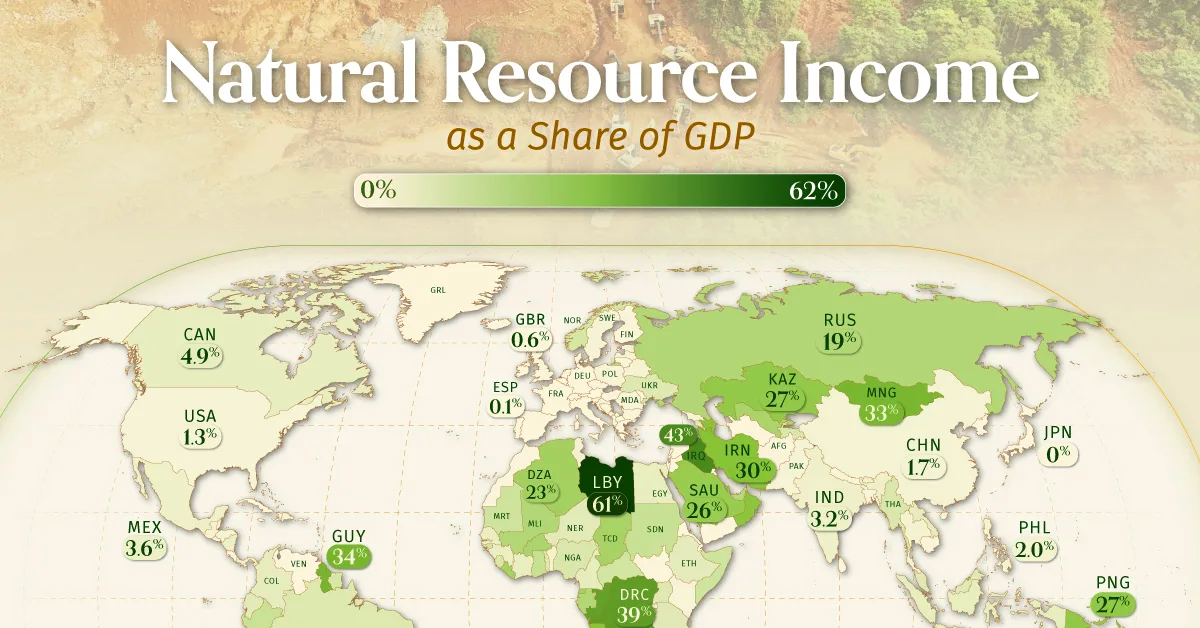
- Libya derives over half of its GDP from natural resource rents, making the country highly exposed to commodity price swings.
- Resource dependence is far more common in developing and energy-exporting economies than in advanced industrial nations.
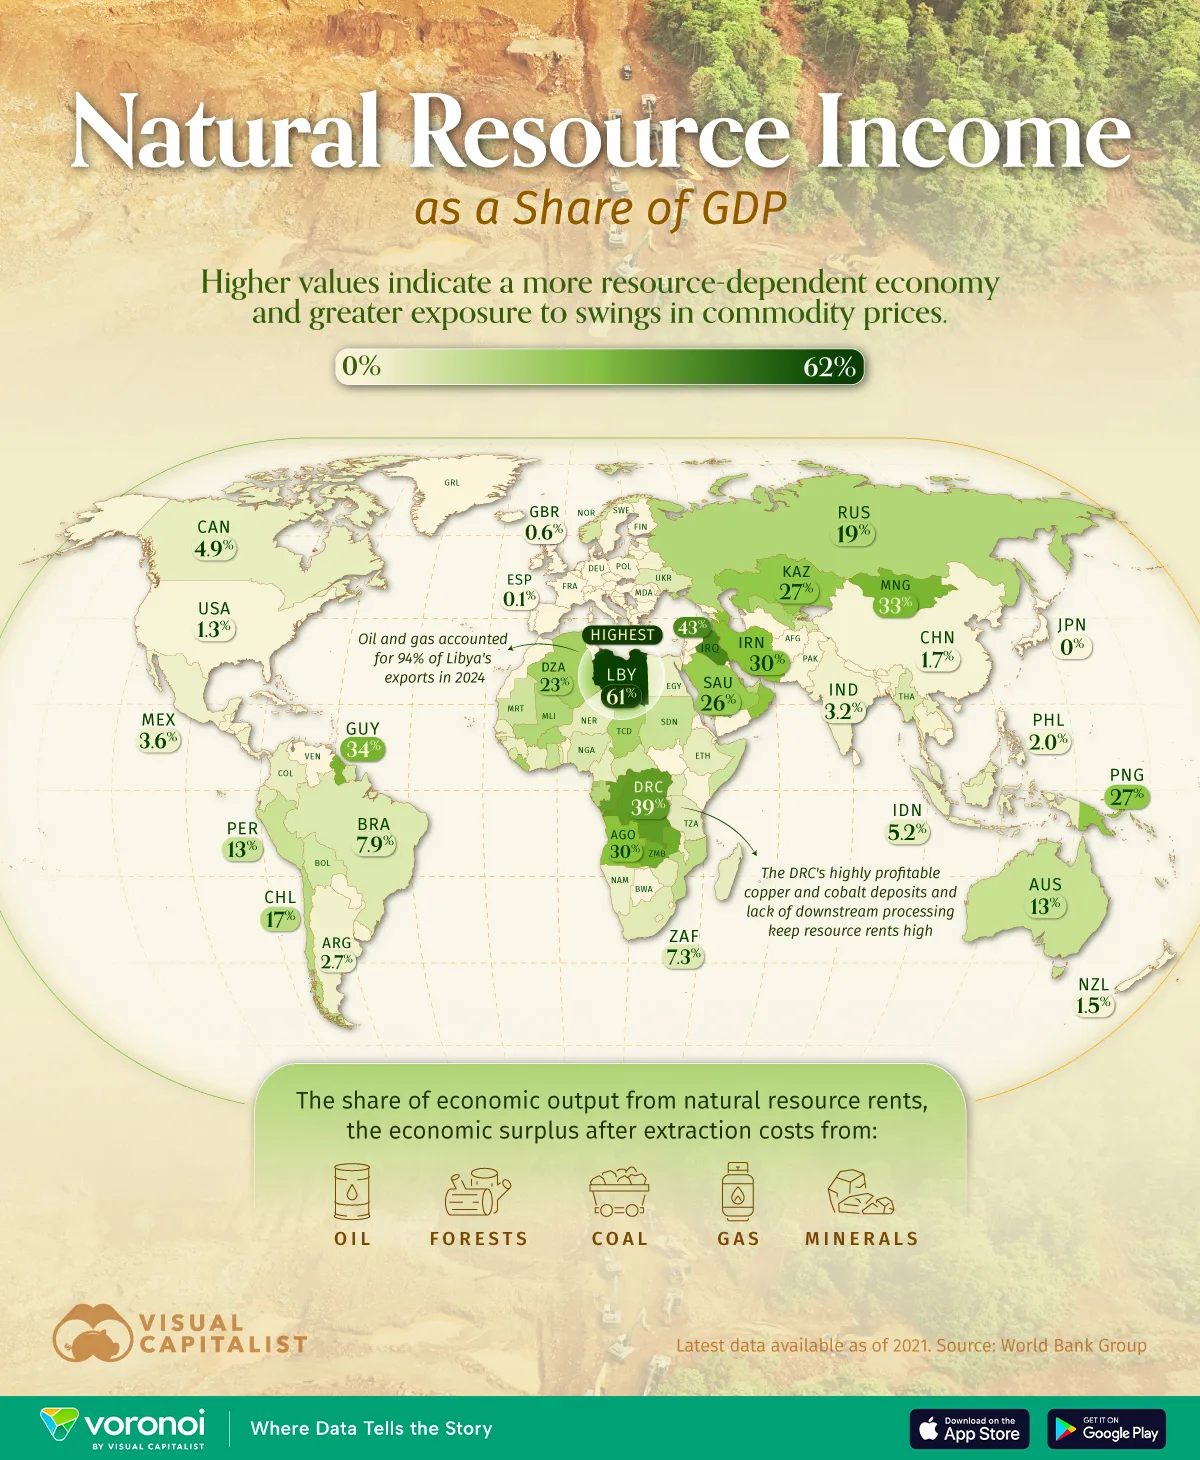
Natural resources remain a powerful driver of economic output for many countries. From oil and gas to minerals and forests, these assets can generate enormous income, but they also create vulnerability. This visualization maps natural resource income as a share of GDP, highlighting which economies are most dependent on extracting and selling raw materials.
The data for this visualization comes from the World Bank Group. It measures natural resource rents as a share of GDP in 2021, defined as the economic surplus generated from oil, gas, coal, minerals, and forests after accounting for extraction costs.
Extreme Resource Dependence in Energy Exporters
A small group of countries sits at the extreme end of resource dependence. Libya tops the list, with natural resource rents accounting for 61% of its GDP, reflecting its heavy reliance on oil exports. Iraq, the Democratic Republic of Congo, and the Republic of Congo also derive more than one-third of their economic output from natural resources.
In these economies, government revenues, employment, and foreign exchange earnings are closely tied to global commodity prices.
| Rank | Country | Natural Resources Income (% of GDP) |
|---|---|---|
| 1 |  Libya Libya |
61.03% |
| 2 |  Iraq Iraq |
43.45% |
| 3 |  Democratic Republic of the Congo Democratic Republic of the Congo |
38.83% |
| 4 |  Republic of Congo Republic of Congo |
37.71% |
| 5 |  Zambia Zambia |
35.26% |
| 6 |  Timor-Leste Timor-Leste |
34.73% |
| 7 |  Guyana Guyana |
33.68% |
| 8 |  Mongolia Mongolia |
33.14% |
| 9 |  Iran, Islamic Rep. Iran, Islamic Rep. |
30.45% |
| 10 |  Angola Angola |
29.97% |
| 11 |  Azerbaijan Azerbaijan |
29.94% |
| 12 |  Oman Oman |
29.21% |
| 13 |  Papua New Guinea Papua New Guinea |
27.39% |
| 14 |  Qatar Qatar |
27.29% |
| 15 |  Kazakhstan Kazakhstan |
26.84% |
| 16 |  Saudi Arabia Saudi Arabia |
25.57% |
| 17 |  Brunei Darussalam Brunei Darussalam |
24.28% |
| 18 |  Equatorial Guinea Equatorial Guinea |
23.50% |
| 19 |  Algeria Algeria |
22.59% |
| 20 |  Liberia Liberia |
21.92% |
| 21 |  Chad Chad |
21.34% |
| 22 |  Uzbekistan Uzbekistan |
20.47% |
| 23 |  Burkina Faso Burkina Faso |
20.14% |
| 24 |  Russia Russia |
18.51% |
| 25 |  Gabon Gabon |
18.49% |
| 26 |  Mali Mali |
18.42% |
| 27 |  Solomon Islands Solomon Islands |
18.40% |
| 28 |  Cabo Verde Cabo Verde |
17.66% |
| 29 |  United Arab Emirates United Arab Emirates |
17.63% |
| 30 |  Chile Chile |
16.90% |
| 31 |  New Caledonia New Caledonia |
16.79% |
| 32 |  Bahrain Bahrain |
16.64% |
| 33 |  Mozambique Mozambique |
14.91% |
| 34 |  Burundi Burundi |
13.96% |
| 35 |  Australia Australia |
13.36% |
| 36 |  Ghana Ghana |
13.35% |
| 37 |  Sudan Sudan |
12.75% |
| 38 |  Peru Peru |
12.72% |
| 39 |  Kyrgyz Republic Kyrgyz Republic |
11.51% |
| 40 |  Mauritania Mauritania |
11.45% |
| 41 |  Somalia Somalia |
11.24% |
| 42 |  Guinea-Bissau Guinea-Bissau |
10.43% |
| 43 |  Central African Republic Central African Republic |
10.26% |
| 44 |  Norway Norway |
10.05% |
| 45 |  Suriname Suriname |
9.59% |
| 46 |  Bolivia Bolivia |
9.47% |
| 47 |  Tajikistan Tajikistan |
9.05% |
| 48 |  Sierra Leone Sierra Leone |
9.04% |
| 49 |  Myanmar Myanmar |
8.68% |
| 50 |  Nigeria Nigeria |
8.55% |
| 51 |  Brazil Brazil |
7.94% |
| 52 |  Togo Togo |
7.86% |
| 53 |  Trinidad and Tobago Trinidad and Tobago |
7.86% |
| 54 |  Ukraine Ukraine |
7.51% |
| 55 |  Uganda Uganda |
7.48% |
| 56 |  South Africa South Africa |
7.33% |
| 57 |  Armenia Armenia |
7.05% |
| 58 |  Malaysia Malaysia |
6.92% |
| 59 |  Ecuador Ecuador |
6.70% |
| 60 |  Tanzania Tanzania |
6.69% |
| 61 |  Niger Niger |
6.41% |
| 62 |  Zimbabwe Zimbabwe |
6.40% |
| 63 |  Ethiopia Ethiopia |
5.87% |
| 64 |  Madagascar Madagascar |
5.53% |
| 65 |  Cameroon Cameroon |
5.53% |
| 66 |  Lao PDR Lao PDR |
5.38% |
| 67 |  Colombia Colombia |
5.32% |
| 68 |  Indonesia Indonesia |
5.16% |
| 69 |  Egypt Egypt |
5.14% |
| 70 |  Canada Canada |
4.95% |
| 71 |  Cote d’Ivoire Cote d’Ivoire |
4.74% |
| 72 |  Guinea Guinea |
4.52% |
| 73 |  Senegal Senegal |
4.40% |
| 74 |  Lesotho Lesotho |
4.32% |
| 75 |  Malawi Malawi |
4.22% |
| 76 |  Namibia Namibia |
4.03% |
| 77 |  Rwanda Rwanda |
4.02% |
| 78 |  Nicaragua Nicaragua |
3.84% |
| 79 |  Panama Panama |
3.66% |
| 80 |  Mexico Mexico |
3.64% |
| 81 |  India India |
3.16% |
| 82 |  Eswatini Eswatini |
3.00% |
| 83 |  Gambia, The Gambia, The |
2.86% |
| 84 |  Bhutan Bhutan |
2.73% |
| 85 |  Argentina Argentina |
2.65% |
| 86 |  Viet Nam Viet Nam |
2.55% |
| 87 |  Benin Benin |
2.30% |
| 88 |  Fiji Fiji |
2.25% |
| 89 |  Tunisia Tunisia |
2.25% |
| 90 |  Dominican Republic Dominican Republic |
2.08% |
| 91 |  Philippines Philippines |
1.97% |
| 92 |  Guatemala Guatemala |
1.93% |
| 93 |  Uruguay Uruguay |
1.93% |
| 94 |  Sao Tome and Principe Sao Tome and Principe |
1.88% |
| 95 |  Belarus Belarus |
1.86% |
| 96 |  Thailand Thailand |
1.82% |
| 97 |  Serbia Serbia |
1.75% |
| 98 |  Estonia Estonia |
1.72% |
| 99 |  China China |
1.71% |
| 100 |  Comoros Comoros |
1.63% |
| 101 |  New Zealand New Zealand |
1.49% |
| 102 |  Albania Albania |
1.44% |
| 103 |  Pakistan Pakistan |
1.44% |
| 104 |  Georgia Georgia |
1.39% |
| 105 |  Paraguay Paraguay |
1.35% |
| 106 |  United States United States |
1.28% |
| 107 |  Kenya Kenya |
1.23% |
| 108 |  Honduras Honduras |
1.22% |
| 109 |  Sweden Sweden |
1.21% |
| 110 |  Latvia Latvia |
1.17% |
| 111 |  Romania Romania |
1.14% |
| 112 |  Botswana Botswana |
1.04% |
| 113 |  Poland Poland |
1.03% |
| 114 |  Kosovo Kosovo |
0.93% |
| 115 |  Bulgaria Bulgaria |
0.92% |
| 116 |  Cambodia Cambodia |
0.84% |
| 117 |  Turkiye Turkiye |
0.83% |
| 118 |  Bosnia and Herzegovina Bosnia and Herzegovina |
0.81% |
| 119 |  Costa Rica Costa Rica |
0.76% |
| 120 |  Croatia Croatia |
0.68% |
| 121 |  Montenegro Montenegro |
0.64% |
| 122 |  Bangladesh Bangladesh |
0.61% |
| 123 |  United Kingdom United Kingdom |
0.59% |
| 124 |  Vanuatu Vanuatu |
0.57% |
| 125 |  El Salvador El Salvador |
0.54% |
| 126 |  Belize Belize |
0.52% |
| 127 |  Nepal Nepal |
0.50% |
| 128 |  Jamaica Jamaica |
0.46% |
| 129 |  Finland Finland |
0.45% |
| 130 |  Israel Israel |
0.44% |
| 131 |  Afghanistan Afghanistan |
0.43% |
| 132 |  Hungary Hungary |
0.40% |
| 133 |  Czechia Czechia |
0.39% |
| 134 |  Morocco Morocco |
0.39% |
| 135 |  Netherlands Netherlands |
0.34% |
| 136 |  Denmark Denmark |
0.34% |
| 137 |  Barbados Barbados |
0.33% |
| 138 |  Haiti Haiti |
0.33% |
| 139 |  Portugal Portugal |
0.29% |
| 140 |  Lithuania Lithuania |
0.29% |
| 141 |  Samoa Samoa |
0.28% |
| 142 |  Djibouti Djibouti |
0.28% |
| 143 |  Moldova Moldova |
0.24% |
| 144 |  Slovak Republic Slovak Republic |
0.23% |
| 145 |  Slovenia Slovenia |
0.19% |
| 146 |  North Macedonia North Macedonia |
0.14% |
| 147 |  Seychelles Seychelles |
0.12% |
| 148 |  Austria Austria |
0.12% |
| 149 |  Spain Spain |
0.12% |
| 150 |  Italy Italy |
0.11% |
| 151 |  Ireland Ireland |
0.10% |
| 152 |  Greece Greece |
0.09% |
| 153 |  Sri Lanka Sri Lanka |
0.08% |
| 154 |  Jordan Jordan |
0.08% |
| 155 |  Germany Germany |
0.08% |
| 156 |  Korea, Rep. Korea, Rep. |
0.05% |
| 157 |  Japan Japan |
0.05% |
| 158 |  Belgium Belgium |
0.04% |
| 159 |  Kiribati Kiribati |
0.04% |
| 160 |  Tonga Tonga |
0.04% |
| 161 |  Dominica Dominica |
0.03% |
| 162 |  France France |
0.03% |
| 163 |  St. Vincent and the Grenadines St. Vincent and the Grenadines |
0.02% |
| 164 |  Micronesia, Fed. Sts. Micronesia, Fed. Sts. |
0.02% |
| 165 |  The Bahamas The Bahamas |
0.01% |
| 166 |  St. Lucia St. Lucia |
0.01% |
| 167 |  Cyprus Cyprus |
0.01% |
| 168 |  Switzerland Switzerland |
0.01% |
| 169 |  Luxembourg Luxembourg |
0.00% |
| 170 |  Maldives Maldives |
0.00% |
| 171 |  French Polynesia French Polynesia |
0.00% |
| 172 |  Turks and Caicos Islands Turks and Caicos Islands |
0.00% |
| 173 |  Lebanon Lebanon |
0.00% |
| 174 |  Mauritius Mauritius |
0.00% |
| 175 |  Aruba Aruba |
0.00% |
| 176 |  Hong Kong Hong Kong |
0.00% |
| 177 |  Macao Macao |
0.00% |
| 178 |  Singapore Singapore |
0.00% |
| 179 |  Iceland Iceland |
0.00% |
| 180 |  Andorra Andorra |
0.00% |
| 181 |  Antigua and Barbuda Antigua and Barbuda |
0.00% |
| 182 |  American Samoa American Samoa |
0.00% |
| 183 |  Bermuda Bermuda |
0.00% |
| 184 |  Cuba Cuba |
0.00% |
| 185 |  Curacao Curacao |
0.00% |
| 186 |  Eritrea Eritrea |
0.00% |
| 187 |  Faroe Islands Faroe Islands |
0.00% |
| 188 |  Grenada Grenada |
0.00% |
| 189 |  Gibraltar Gibraltar |
0.00% |
| 190 |  Greenland Greenland |
0.00% |
| 191 |  Guam Guam |
0.00% |
| 192 |  Isle of Man Isle of Man |
0.00% |
| 193 | Channel Islands | 0.00% |
| 194 |  St. Kitts and Nevis St. Kitts and Nevis |
0.00% |
| 195 |  North Korea North Korea |
0.00% |
| 196 |  Kuwait Kuwait |
0.00% |
| 197 |  Cayman Islands Cayman Islands |
0.00% |
| 198 |  Liechtenstein Liechtenstein |
0.00% |
| 199 |  Monaco Monaco |
0.00% |
| 200 |  St. Martin (French part) St. Martin (French part) |
0.00% |
| 201 |  Marshall Islands Marshall Islands |
0.00% |
| 202 |  Northern Mariana Islands Northern Mariana Islands |
0.00% |
| 203 |  Malta Malta |
0.00% |
| 204 |  Nauru Nauru |
0.00% |
| 205 |  Puerto Rico (U.S.) Puerto Rico (U.S.) |
0.00% |
| 206 |  West Bank and Gaza West Bank and Gaza |
0.00% |
| 207 |  Palau Palau |
0.00% |
| 208 |  San Marino San Marino |
0.00% |
| 209 |  South Sudan South Sudan |
0.00% |
| 210 |  Sint Maarten (Dutch part) Sint Maarten (Dutch part) |
0.00% |
| 211 |  Syrian Arab Republic Syrian Arab Republic |
0.00% |
| 212 |  Turkmenistan Turkmenistan |
0.00% |
| 213 |  Tuvalu Tuvalu |
0.00% |
| 214 |  Venezuela, RB Venezuela, RB |
0.00% |
| 215 |  British Virgin Islands British Virgin Islands |
0.00% |
| 216 |  Virgin Islands (U.S.) Virgin Islands (U.S.) |
0.00% |
| 217 |  Yemen, Rep. Yemen, Rep. |
0.00% |
Many of the most resource-dependent countries are concentrated in the Middle East and Africa. Oil- and gas-rich nations such as Iran, Angola, Oman, Qatar, and Saudi Arabia feature prominently.
In sub-Saharan Africa, mineral exporters like Zambia and Mongolia, along with oil producers such as Equatorial Guinea and Chad, rely heavily on resource rents.
Advanced Economies Show Low Resource Reliance
In contrast, most advanced economies generate only a small share of GDP from natural resources. Countries such as the United States, Germany, Japan, France, and the United Kingdom all register resource rents near or below 1% of GDP.
Even resource-rich developed nations like Norway and Australia show relatively moderate dependence, reflecting diversified economies with strong manufacturing and services sectors.
Learn More on the Voronoi App 
If you enjoyed today’s post, check out Global GDP Growth Projections in 2025 on Voronoi, the new app from Visual Capitalist.