Mapped: Countries with the Largest Emigrant Populations
This was originally posted on our Voronoi app. Download the app for free on iOS or Android and discover incredible data-driven charts from a variety of trusted sources.
Key Takeaways
- India tops the list with over 18 million citizens living abroad.
- More than 280 million people live outside their country of birth.
- Some small countries, like Guyana and Samoa, have over half their populations living outside their borders.
- Conflict, jobs, and opportunity are major drivers of emigration.
Migration is often viewed through the lens of immigration (people arriving in a country). But what about those leaving?
This infographic by Iswardi Ishak, using data from the UN Department of Economic and Social Affairs, maps the countries with the highest number of citizens living abroad in 2024.
What is Emigration, and Why Does It Matter?
Simply put, emigration is the opposite of immigration. It refers to the act of leaving one’s country to live elsewhere. While commonly discussed in regions receiving migrants, emigration has major impacts on origin countries too, from remittances to brain drain.
The reasons for leaving vary. Common “push factors” include poverty, violence, corruption, and climate change. Conversely, “pull factors” are driven by better education, jobs, healthcare, and safety abroad.
Ranked: Top Countries by Emigrant Populations
The table below lists the top countries with the highest number of emigrants around the world.
| Rank | Country/Territory | Emigrants | Total Population | Emigrants as % of Total Pop |
|---|---|---|---|---|
| 1 |  India India |
18,533,845 | 1,450,935,791 | 1.3% |
| 2 |  China China |
11,701,619 | 1,419,321,278 | 0.8% |
| 3 |  Mexico Mexico |
11,596,529 | 130,861,007 | 8.9% |
| 4 |  Ukraine Ukraine |
9,769,216 | 37,860,222 | 25.8% |
| 5 |  Russia Russia |
9,134,094 | 144,820,423 | 6.3% |
| 6 |  Syria Syria |
8,927,523 | 24,672,760 | 36.2% |
| 7 |  Bangladesh Bangladesh |
8,706,947 | 173,562,364 | 5.0% |
| 8 |  Venezuela Venezuela |
8,328,514 | 28,405,543 | 29.3% |
| 9 |  Afghanistan Afghanistan |
7,528,994 | 42,647,492 | 17.7% |
| 10 |  Philippines Philippines |
6,988,383 | 115,843,670 | 6.0% |
| 11 |  Pakistan Pakistan |
6,915,057 | 251,269,164 | 2.8% |
| 12 |  Egypt Egypt |
4,820,002 | 116,538,258 | 4.1% |
| 13 |  United Kingdom United Kingdom |
4,804,944 | 69,138,192 | 6.9% |
| 14 |  Romania Romania |
4,583,819 | 19,015,088 | 24.1% |
| 15 |  Poland Poland |
4,572,613 | 38,539,201 | 11.9% |
| 16 |  Myanmar Myanmar |
4,320,462 | 54,500,091 | 7.9% |
| 17 |  Germany Germany |
4,297,233 | 84,552,242 | 5.1% |
| 18 |  Sudan Sudan |
3,786,603 | 50,448,963 | 7.5% |
| 19 |  Indonesia Indonesia |
3,745,148 | 283,487,931 | 1.3% |
| 20 |  Vietnam Vietnam |
3,693,537 | 100,987,687 | 3.7% |
| 21 |  Colombia Colombia |
3,652,238 | 52,886,364 | 6.9% |
| 22 |  Morocco Morocco |
3,627,829 | 38,081,173 | 9.5% |
| 23 |  United States United States |
3,186,999 | 345,426,571 | 0.9% |
| 24 |  South Sudan South Sudan |
3,168,836 | 11,943,409 | 26.5% |
| 25 |  Turkiye Turkiye |
3,130,337 | 87,473,805 | 3.6% |
| 26 |  Italy Italy |
2,941,444 | 59,342,867 | 5.0% |
| 27 |  Kazakhstan Kazakhstan |
2,796,572 | 20,592,571 | 13.6% |
| 28 |  Nepal Nepal |
2,637,195 | 29,651,055 | 8.9% |
| 29 |  France France |
2,547,158 | 66,548,530 | 3.8% |
| 30 |  Yemen Yemen |
2,480,734 | 40,583,165 | 6.1% |
| 31 |  Malaysia Malaysia |
2,433,875 | 35,557,674 | 6.8% |
| 32 |  Iraq Iraq |
2,313,028 | 46,042,015 | 5.0% |
| 33 |  Brazil Brazil |
2,194,325 | 211,998,574 | 1.0% |
| 34 |  Uzbekistan Uzbekistan |
2,114,480 | 36,361,859 | 5.8% |
| 35 |  Congo,Dem.Rep. Congo,Dem.Rep. |
2,097,387 | 109,276,265 | 1.9% |
| 36 |  Nigeria Nigeria |
2,094,265 | 232,679,478 | 0.9% |
| 37 |  Burkina Faso Burkina Faso |
2,050,050 | 23,548,781 | 8.7% |
| 38 |  South Korea South Korea |
2,030,473 | 51,717,590 | 3.9% |
| 39 |  Haiti Haiti |
2,017,692 | 11,772,557 | 17.1% |
| 40 |  Somalia Somalia |
1,935,594 | 19,009,151 | 10.2% |
| 41 |  Dominican Republic Dominican Republic |
1,917,153 | 11,427,557 | 16.8% |
| 42 |  El Salvador El Salvador |
1,834,670 | 6,338,193 | 28.9% |
| 43 |  Portugal Portugal |
1,799,179 | 10,425,293 | 17.3% |
| 44 |  Algeria Algeria |
1,780,399 | 46,814,308 | 3.8% |
| 45 |  Iran Iran |
1,733,468 | 91,567,738 | 1.9% |
| 46 |  Peru Peru |
1,672,482 | 34,217,848 | 4.9% |
| 47 |  Spain Spain |
1,623,550 | 47,910,527 | 3.4% |
| 48 |  Bosnia and Herzegovina Bosnia and Herzegovina |
1,608,324 | 3,164,253 | 50.8% |
| 49 |  Zimbabwe Zimbabwe |
1,519,324 | 16,634,373 | 9.1% |
| 50 |  Sri Lanka Sri Lanka |
1,492,103 | 23,103,565 | 6.5% |
| 51 |  Guatemala Guatemala |
1,460,232 | 18,406,359 | 7.9% |
| 52 |  Honduras Honduras |
1,397,584 | 10,825,704 | 12.9% |
| 53 |  Canada Canada |
1,347,381 | 39,742,430 | 3.4% |
| 54 |  Mali Mali |
1,292,519 | 24,478,596 | 5.3% |
| 55 |  Bulgaria Bulgaria |
1,252,234 | 6,757,689 | 18.5% |
| 56 |  Jamaica Jamaica |
1,248,512 | 2,839,175 | 44.0% |
| 57 |  Ecuador Ecuador |
1,243,065 | 18,135,478 | 6.9% |
| 58 |  Ethiopia Ethiopia |
1,240,645 | 132,059,767 | 0.9% |
| 59 |  Hong Kong SAR,China Hong Kong SAR,China |
1,240,250 | 7,414,910 | 16.7% |
| 60 |  Albania Albania |
1,216,628 | 2,791,765 | 43.6% |
| 61 |  Coted’Ivoire Coted’Ivoire |
1,211,422 | 31,934,230 | 3.8% |
| 62 |  Argentina Argentina |
1,183,381 | 45,696,159 | 2.6% |
| 63 |  Thailand Thailand |
1,178,757 | 71,668,011 | 1.6% |
| 64 |  Ghana Ghana |
1,055,494 | 34,427,414 | 3.1% |
| 65 |  Japan Japan |
1,008,173 | 123,753,041 | 0.8% |
| 66 |  South Africa South Africa |
1,005,800 | 64,007,187 | 1.6% |
| 67 |  Serbia Serbia |
963,307 | 6,736,216 | 14.3% |
| 68 |  Central African Republic Central African Republic |
905,808 | 5,330,690 | 17.0% |
| 69 |  Nicaragua Nicaragua |
905,251 | 6,916,140 | 13.1% |
| 70 |  Moldova Moldova |
864,257 | 3,034,961 | 28.5% |
| 71 |  Croatia Croatia |
826,166 | 3,875,325 | 21.3% |
| 72 |  Azerbaijan Azerbaijan |
810,116 | 10,336,578 | 7.8% |
| 73 |  Belarus Belarus |
790,232 | 9,056,696 | 8.7% |
| 74 |  Bolivia Bolivia |
783,473 | 12,413,315 | 6.3% |
| 75 |  Greece Greece |
780,112 | 10,047,817 | 7.8% |
| 76 |  Cambodia Cambodia |
778,793 | 17,638,801 | 4.4% |
| 77 |  Paraguay Paraguay |
746,362 | 6,929,153 | 10.8% |
| 78 |  Senegal Senegal |
741,357 | 18,501,985 | 4.0% |
| 79 |  Benin Benin |
726,530 | 14,462,724 | 5.0% |
| 80 |  Tunisia Tunisia |
715,249 | 12,277,109 | 5.8% |
| 81 |  Ireland Ireland |
714,405 | 5,255,018 | 13.6% |
| 82 |  Mozambique Mozambique |
702,796 | 34,631,766 | 2.0% |
| 83 |  Lebanon Lebanon |
681,720 | 5,805,962 | 11.7% |
| 84 |  New Zealand New Zealand |
679,772 | 5,213,944 | 13.0% |
| 85 |  Laos Laos |
660,258 | 7,769,819 | 8.5% |
| 86 |  Jordan Jordan |
659,204 | 11,552,876 | 5.7% |
| 87 |  Armenia Armenia |
637,604 | 2,973,841 | 21.4% |
| 88 |  Netherlands Netherlands |
631,391 | 18,228,742 | 3.5% |
| 89 |  Angola Angola |
616,967 | 37,885,850 | 1.6% |
| 90 |  Togo Togo |
584,790 | 9,515,236 | 6.1% |
| 91 |  Czechia Czechia |
583,214 | 10,735,859 | 5.4% |
| 92 |  Uganda Uganda |
578,034 | 50,015,093 | 1.2% |
| 93 |  Burundi Burundi |
576,530 | 14,047,786 | 4.1% |
| 94 |  Kyrgyzstan Kyrgyzstan |
540,573 | 7,186,009 | 7.5% |
| 95 |  Kenya Kenya |
540,466 | 56,432,945 | 1.0% |
| 96 |  Rwanda Rwanda |
539,046 | 14,256,567 | 3.8% |
| 97 |  Hungary Hungary |
538,794 | 9,676,135 | 5.6% |
| 98 |  North Macedonia North Macedonia |
534,616 | 1,823,009 | 29.3% |
| 99 |  Belgium Belgium |
521,884 | 11,738,764 | 4.4% |
| 100 |  Tajikistan Tajikistan |
514,478 | 10,590,928 | 4.9% |
| 101 |  Switzerland Switzerland |
512,547 | 8,921,981 | 5.7% |
| 102 |  Guinea Guinea |
508,203 | 14,754,786 | 3.4% |
| 103 |  Georgia Georgia |
496,486 | 3,807,670 | 13.0% |
| 104 |  Guyana Guyana |
469,649 | 831,087 | 56.5% |
| 105 |  Lithuania Lithuania |
459,268 | 2,859,110 | 16.1% |
| 106 |  Chile Chile |
444,451 | 19,764,772 | 2.2% |
| 107 |  Niger Niger |
439,378 | 27,032,413 | 1.6% |
| 108 |  Australia Australia |
430,718 | 26,713,205 | 1.6% |
| 109 |  Austria Austria |
430,560 | 9,120,813 | 4.7% |
| 110 |  Malawi Malawi |
427,573 | 21,655,286 | 2.0% |
| 111 |  Cameroon Cameroon |
409,677 | 29,123,744 | 1.4% |
| 112 |  Slovakia Slovakia |
389,909 | 5,506,760 | 7.1% |
| 113 |  Comoros Comoros |
367,574 | 866,628 | 42.4% |
| 114 |  Turkmenistan Turkmenistan |
365,787 | 7,494,499 | 4.9% |
| 115 |  Israel Israel |
324,804 | 9,387,021 | 3.5% |
| 116 |  Trinidad and Tobago Trinidad and Tobago |
323,630 | 1,507,782 | 21.5% |
| 117 |  Chad Chad |
292,298 | 20,299,123 | 1.4% |
| 118 |  Singapore Singapore |
269,613 | 5,832,387 | 4.6% |
| 119 |  Uruguay Uruguay |
263,285 | 3,386,588 | 7.8% |
| 120 |  Suriname Suriname |
258,026 | 634,431 | 40.7% |
| 121 |  Lesotho Lesotho |
246,938 | 2,337,423 | 10.6% |
| 122 |  Saudi Arabia Saudi Arabia |
236,699 | 33,962,757 | 0.7% |
| 123 |  Congo Congo |
231,080 | 6,332,961 | 3.6% |
| 124 |  Tanzania Tanzania |
225,017 | 68,560,157 | 0.3% |
| 125 |  Sweden Sweden |
223,508 | 10,606,999 | 2.1% |
| 126 |  Madagascar Madagascar |
212,455 | 31,964,956 | 0.7% |
| 127 |  Panama Panama |
194,816 | 4,515,577 | 4.3% |
| 128 |  Finland Finland |
181,834 | 5,617,311 | 3.2% |
| 129 |  Fiji Fiji |
181,025 | 928,784 | 19.5% |
| 130 |  Mongolia Mongolia |
175,596 | 3,475,540 | 5.1% |
| 131 |  Kuwait Kuwait |
167,850 | 4,934,508 | 3.4% |
| 132 |  United Arab Emirates United Arab Emirates |
166,074 | 11,027,129 | 1.5% |
| 133 |  Latvia Latvia |
161,014 | 1,871,872 | 8.6% |
| 134 |  Libya Libya |
156,874 | 7,381,023 | 2.1% |
| 135 |  Liberia Liberia |
145,919 | 5,612,817 | 2.6% |
| 136 |  Equatorial Guinea Equatorial Guinea |
136,825 | 1,892,517 | 7.2% |
| 137 |  Denmark Denmark |
124,665 | 5,977,412 | 2.1% |
| 138 |  Estonia Estonia |
124,216 | 1,360,546 | 9.1% |
| 139 |  Zambia Zambia |
122,793 | 21,314,956 | 0.6% |
| 140 |  Norway Norway |
120,891 | 5,576,660 | 2.2% |
| 141 |  Samoa Samoa |
119,313 | 218,020 | 54.7% |
| 142 |  Mauritius Mauritius |
114,314 | 1,271,169 | 9.0% |
| 143 |  Timor-Leste Timor-Leste |
109,613 | 1,400,638 | 7.8% |
| 144 |  Guinea-Bissau Guinea-Bissau |
103,999 | 2,201,352 | 4.7% |
| 145 |  Mauritania Mauritania |
91,705 | 5,169,396 | 1.8% |
| 146 |  Montenegro Montenegro |
90,678 | 638,479 | 14.2% |
| 147 |  Cyprus Cyprus |
80,760 | 1,358,282 | 5.9% |
| 148 |  Slovenia Slovenia |
78,808 | 2,118,697 | 3.7% |
| 149 |  Gambia Gambia |
72,452 | 2,759,988 | 2.6% |
| 150 |  Sierra Leone Sierra Leone |
63,631 | 8,642,023 | 0.7% |
| 151 |  Luxembourg Luxembourg |
61,859 | 673,036 | 9.2% |
| 152 |  Gabon Gabon |
61,160 | 2,538,952 | 2.4% |
| 153 |  Bahrain Bahrain |
57,160 | 1,607,049 | 3.6% |
| 154 |  Costa Rica Costa Rica |
50,982 | 5,129,910 | 1.0% |
| 155 |  Brunei Darussalam Brunei Darussalam |
46,552 | 462,722 | 10.1% |
| 156 |  Malta Malta |
43,940 | 539,607 | 8.1% |
| 157 |  Sao Tome and Principe Sao Tome and Principe |
41,433 | 235,537 | 17.6% |
| 158 |  Namibia Namibia |
40,371 | 3,030,131 | 1.3% |
| 159 |  Papua New Guinea Papua New Guinea |
35,050 | 10,576,502 | 0.3% |
| 160 |  Grenada Grenada |
26,300 | 117,208 | 22.4% |
| 161 |  Iceland Iceland |
23,326 | 393,396 | 5.9% |
| 162 |  Seychelles Seychelles |
22,191 | 130,419 | 17.0% |
| 163 |  Dominica Dominica |
21,384 | 66,205 | 32.3% |
| 164 |  Qatar Qatar |
19,821 | 3,048,423 | 0.7% |
| 165 |  Barbados Barbados |
19,558 | 282,468 | 6.9% |
| 166 |  Oman Oman |
17,095 | 5,281,538 | 0.3% |
| 167 |  Botswana Botswana |
16,731 | 2,521,139 | 0.7% |
| 168 |  Vanuatu Vanuatu |
15,202 | 327,778 | 4.6% |
| 169 |  Antigua and Barbuda Antigua and Barbuda |
13,111 | 93,772 | 14.0% |
| 170 |  Eswatini Eswatini |
11,561 | 1,242,822 | 0.9% |
| 171 |  Solomon Islands Solomon Islands |
8,352 | 819,198 | 1.0% |
| 172 |  Belize Belize |
7,383 | 417,072 | 1.8% |
| 173 |  Kiribati Kiribati |
6,306 | 134,518 | 4.7% |
| 174 |  Djibouti Djibouti |
3,576 | 1,168,722 | 0.3% |
| 175 |  Maldives Maldives |
2,773 | 527,799 | 0.5% |
| 176 |  Bahamas Bahamas |
2,174 | 401,283 | 0.5% |
| 177 |  Andorra Andorra |
1,982 | 81,938 | 2.4% |
| 178 |  Bermuda Bermuda |
1,100 | 64,637 | 1.7% |
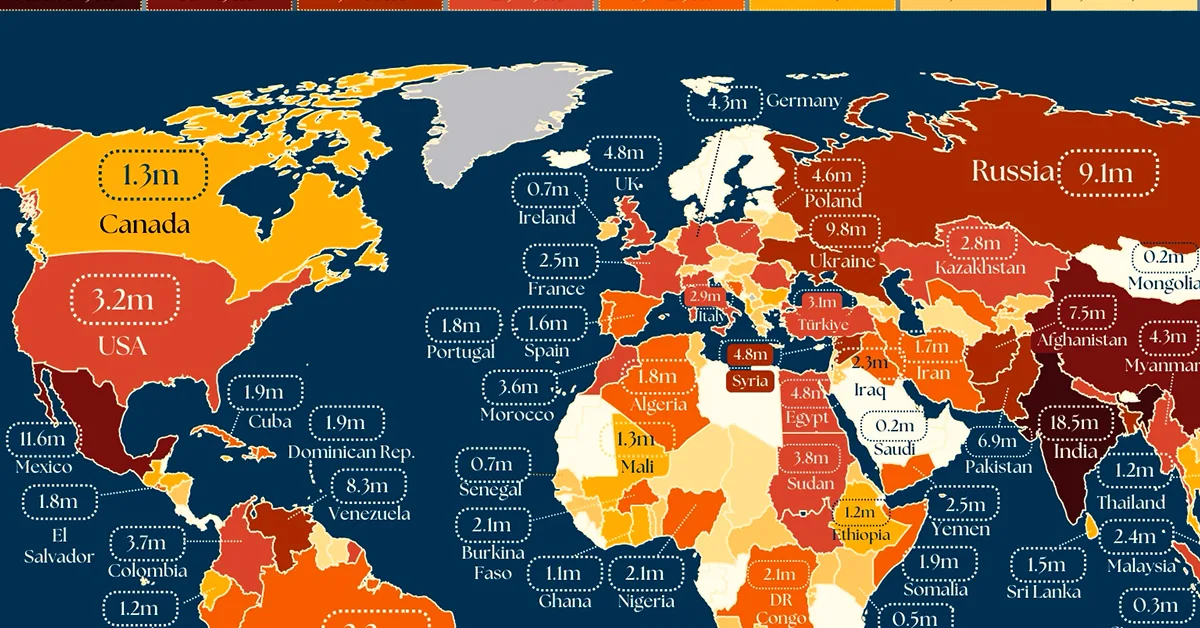
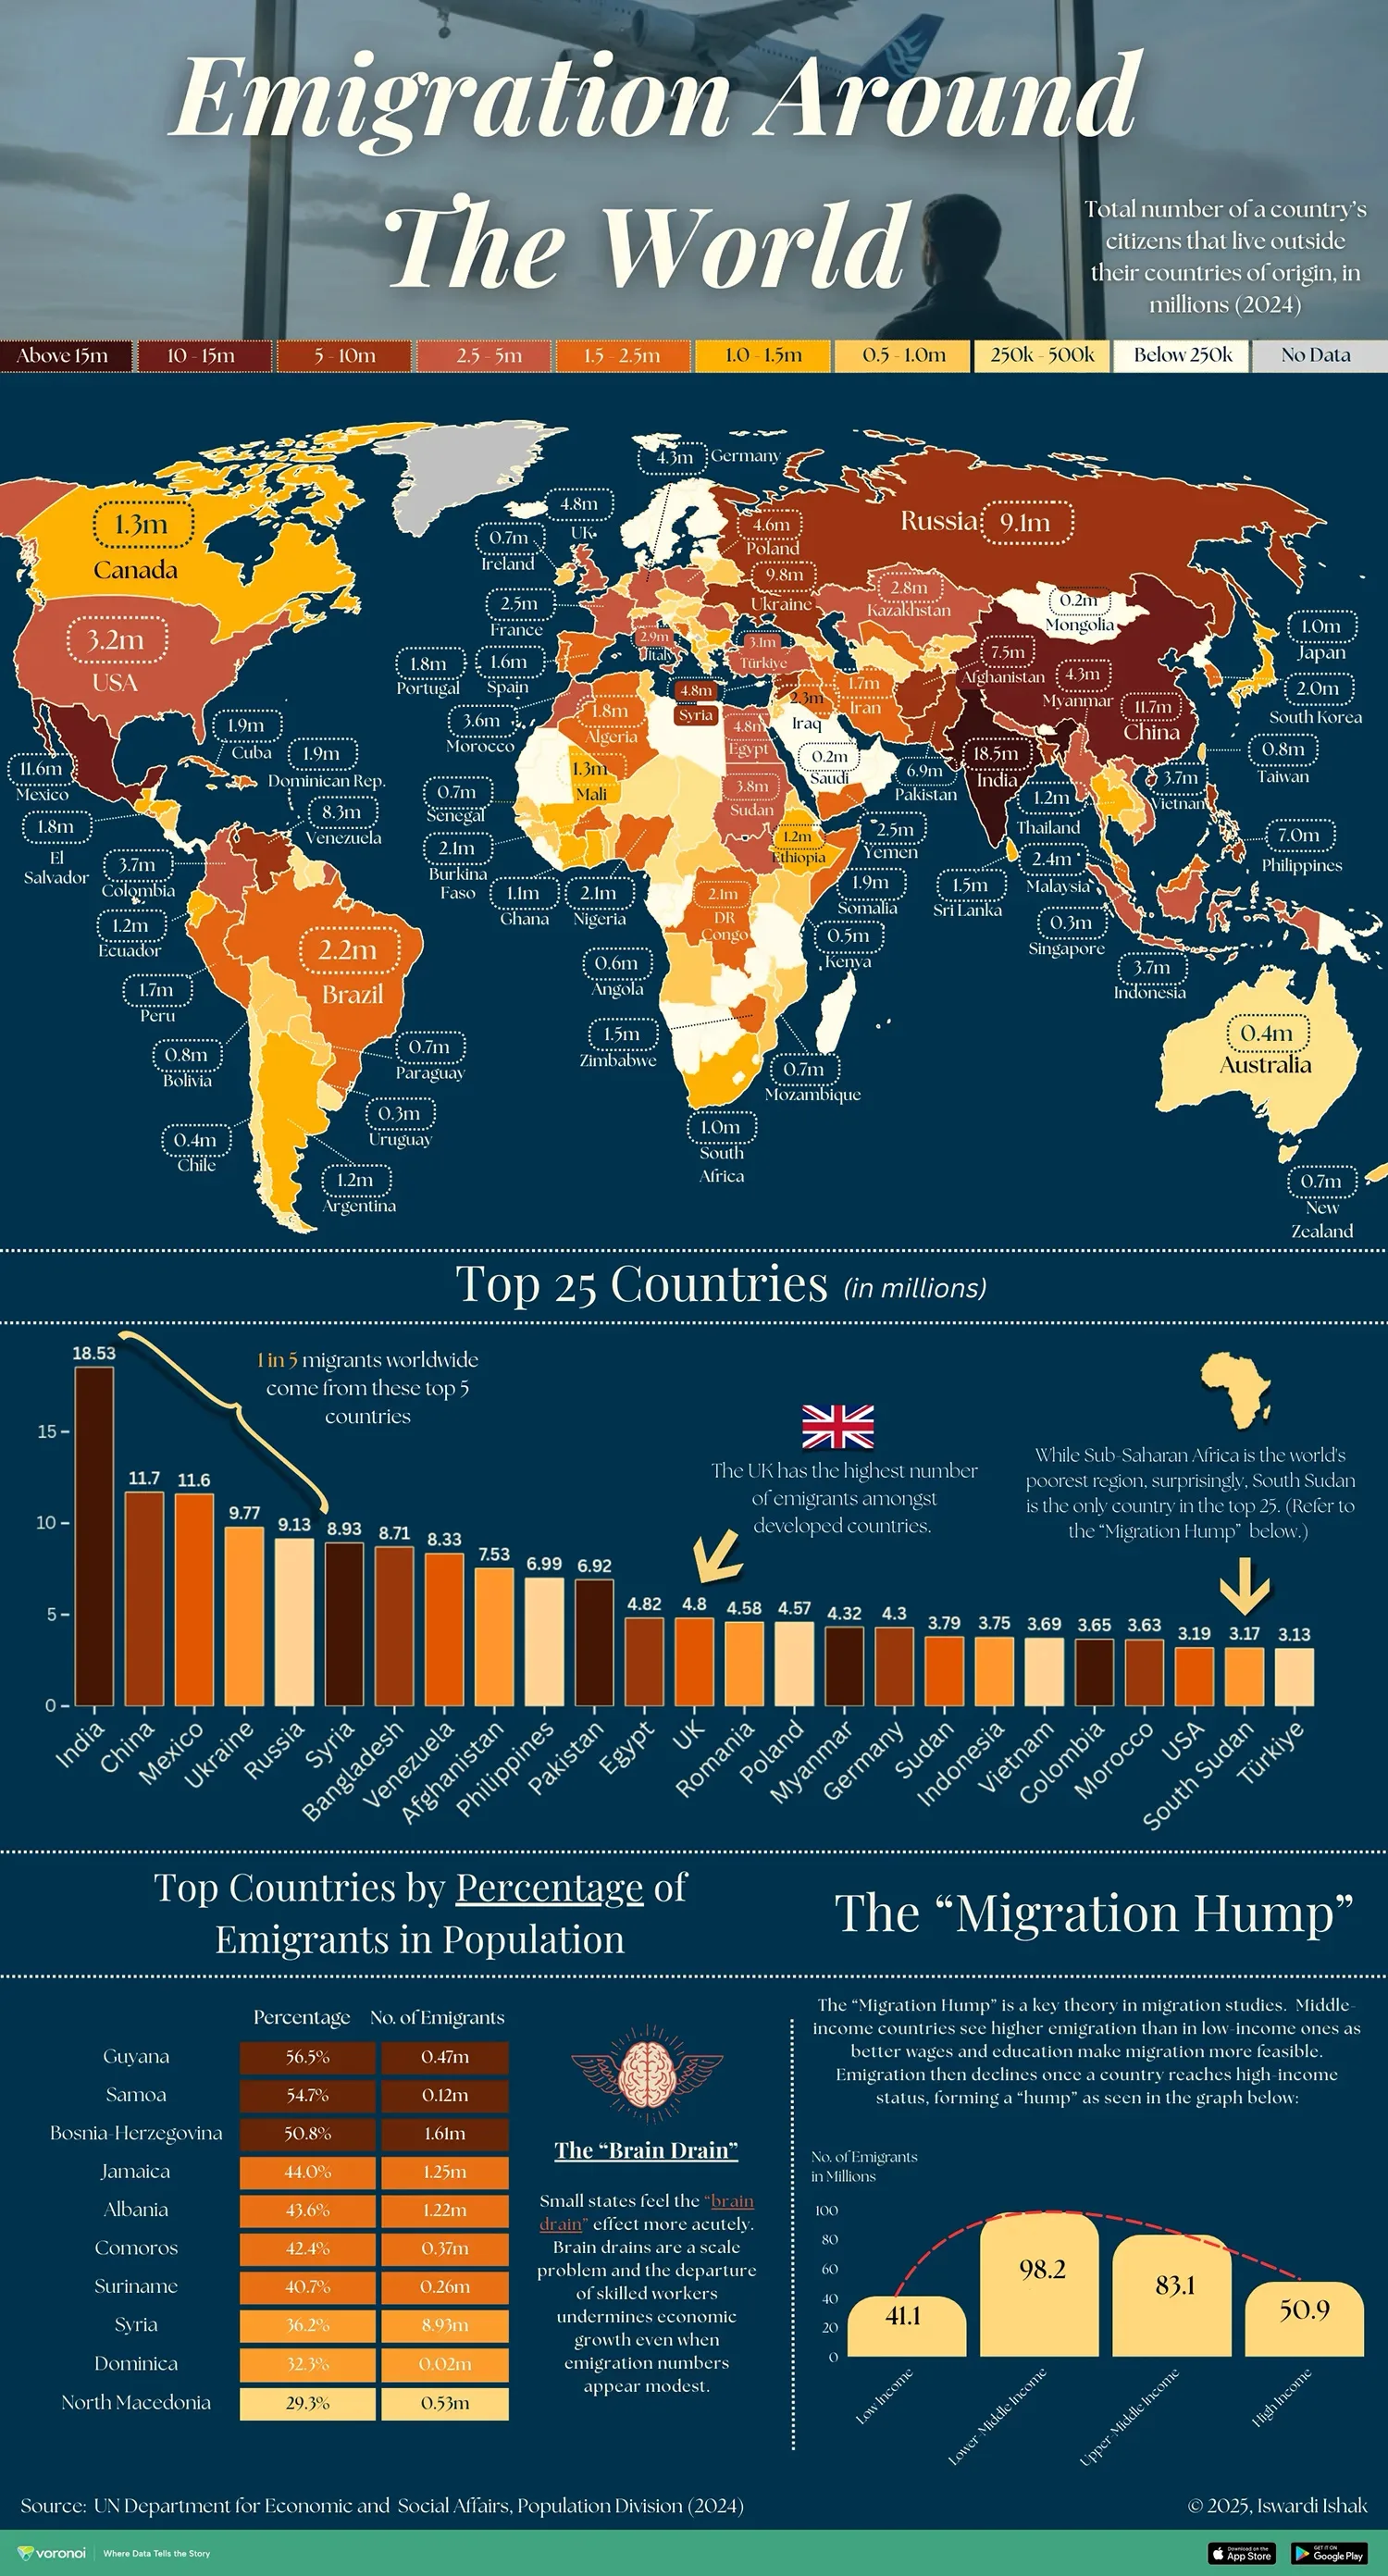
A closer look at the data shows that just five countries account for roughly one in five global emigrants.
Unsurprisingly, populous countries dominate the top of the list. India leads with over 18 million citizens abroad, followed by China (11.7 million), Mexico (11.6 million) and Ukraine (9.8 million). Meanwhile, countries like South Sudan and Syria have high emigration numbers relative to their total populations, driven by conflict and instability.
Of developed nations, the UK stands out with 4.8 million emigrants, largely driven by retirees, expats, and long-standing diasporas.
The “Brain Drain” and High Emigration Rates
When viewed as a share of total population, smaller countries top the list. In Guyana, Samoa, and Bosnia & Herzegovina, over 50% of citizens live abroad. This reflects a classic “brain drain” effect, where educated or skilled workers leave for better prospects, often slowing economic growth at home.
Explaining the “Migration Hump”
A key theory in migration studies is the “Migration Hump”. It suggests that emigration rises as countries move from low- to middle-income status, when people gain the means and motivation to move. As prosperity continues and countries become high-income, emigration rates drop.
This phenomenon helps explain why middle-income nations like Egypt, the Philippines, and Pakistan feature prominently in the dataset.
Learn More on the Voronoi App 
Check out our related chart: The Top Sources of Immigrants: 1995 vs 2020 on Voronoi.