 See more visualizations like this on the Voronoi app.
Mapped: Which Countries Use Claude AI the Most
See visuals like this from many other data creators on our Voronoi app. Download it for free on iOS or Android and discover incredible data-driven charts from a variety of trusted sources.
Key Takeaways
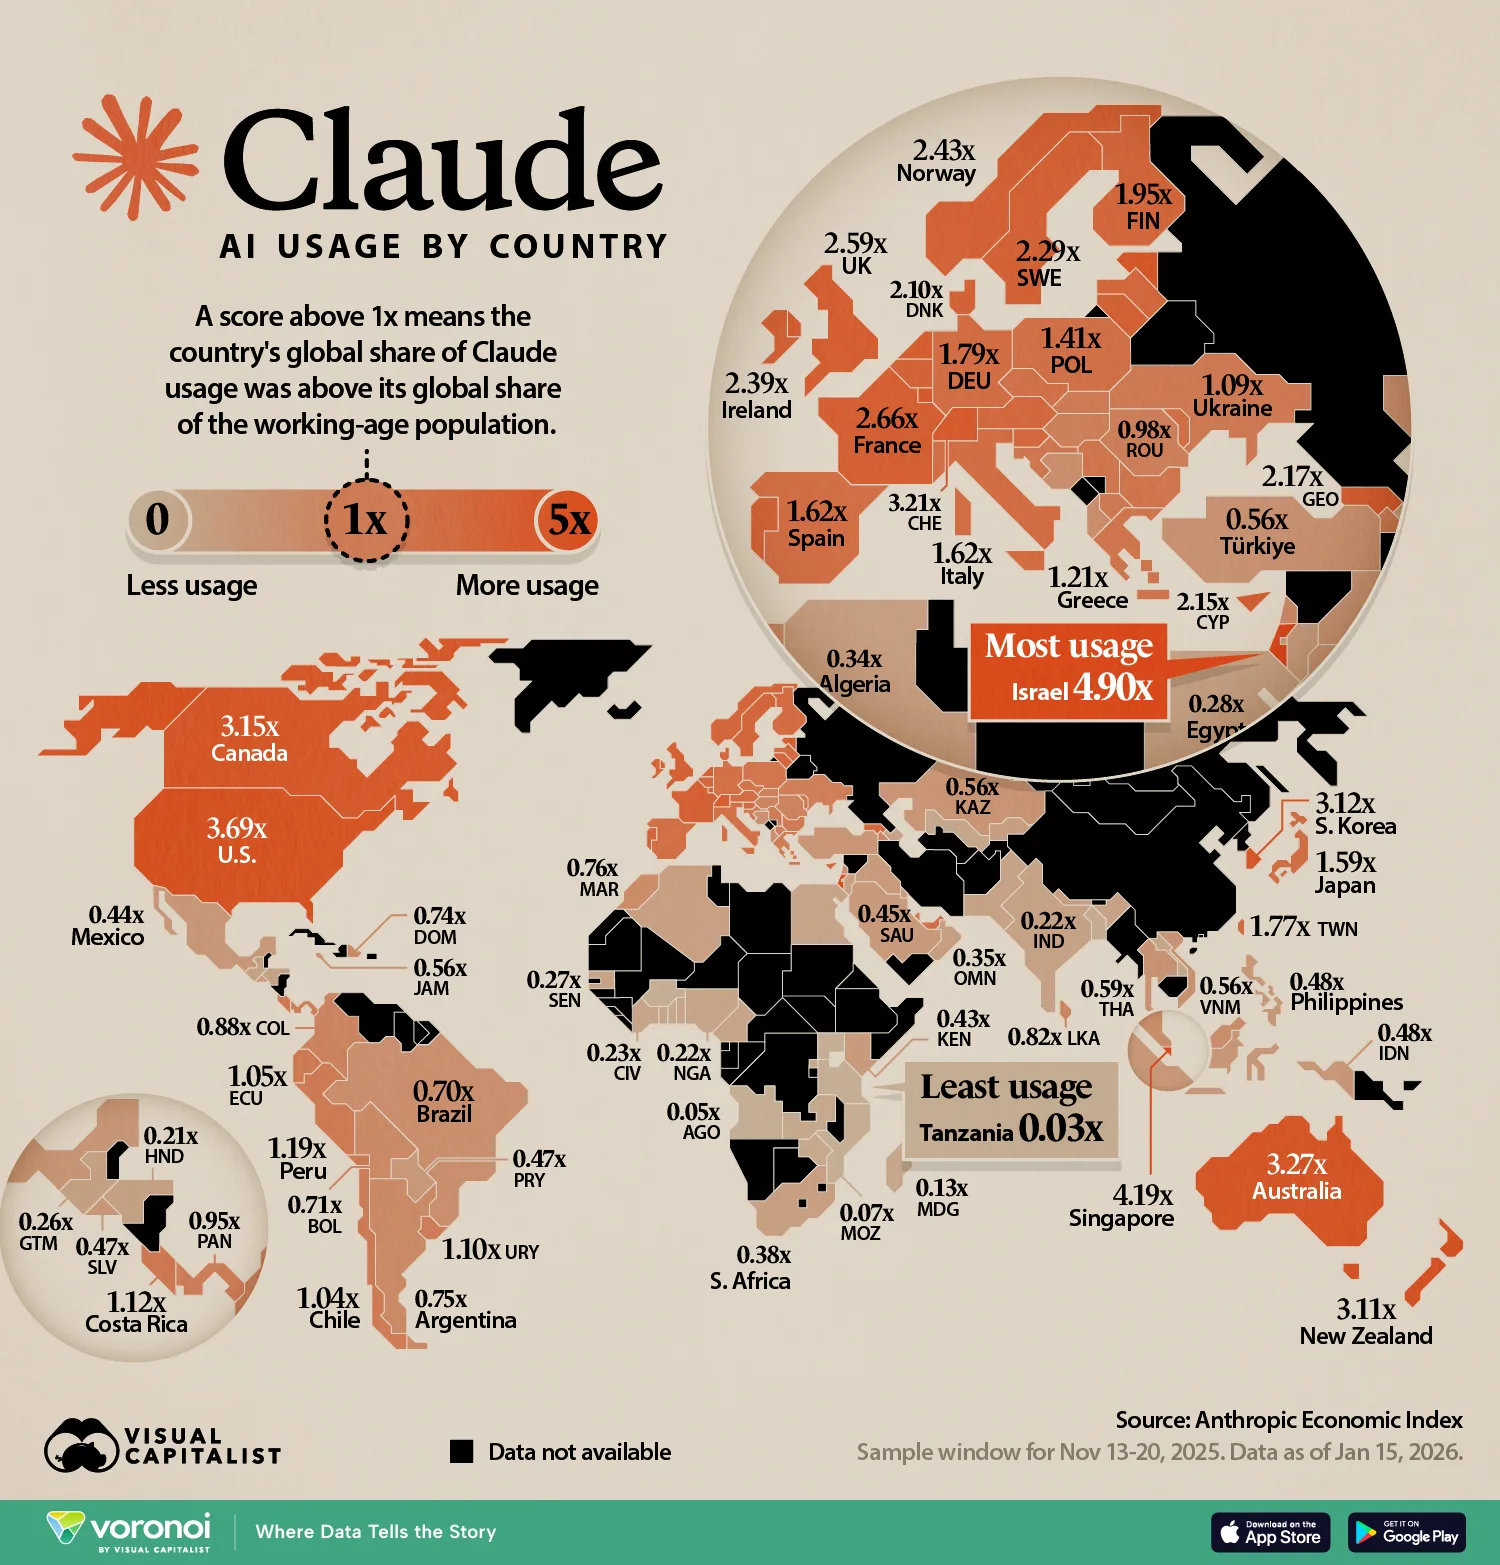
- Israel, Singapore, and the U.S. lead Anthropic’s Claude usage index, which measures usage relative to each country’s working-age population.
- The U.S. dominates in raw usage, but smaller countries rank higher on adoption intensity.
- Claude usage is strongest across North America, Europe, Oceania, and parts of Asia.
New data from Anthropic reveals where its Claude AI chatbot is gaining the most traction worldwide.
While Israel tops the overall ranking, the United States leads among countries with at least 10,000 Claude conversations, scoring 3.69x on the index.
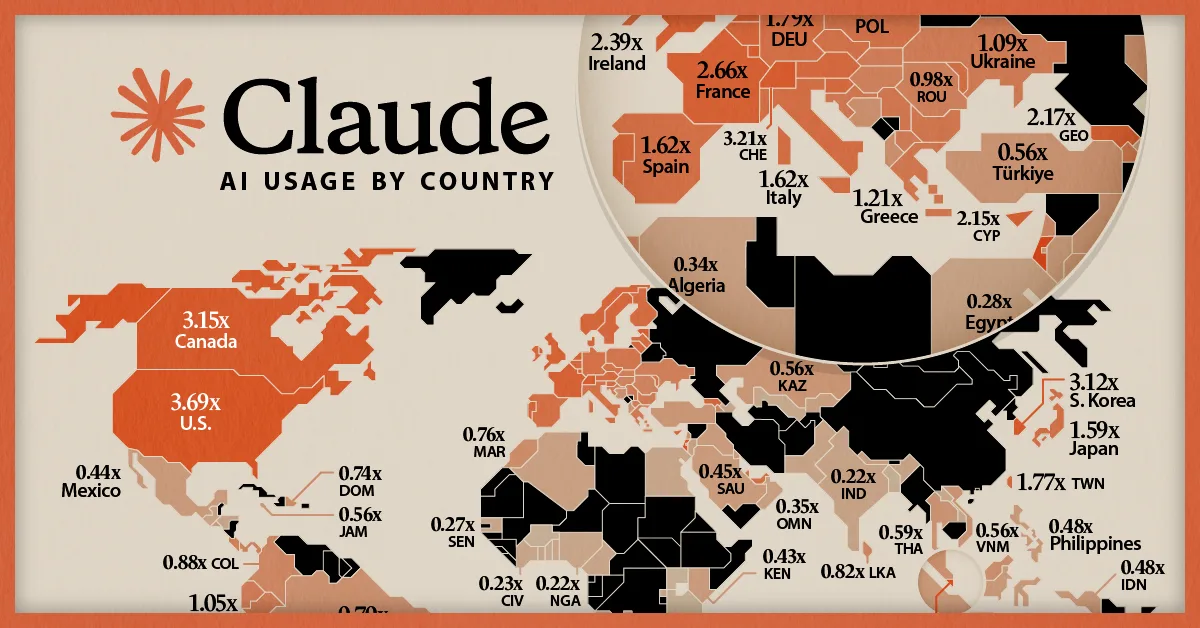
This visualization maps which countries use it the most relative to their working-age population, according to the Anthropic AI Usage Index.
Where Claude Usage Is Highest by Country
Dive into the data below, which was collected across 116 countries in the week of Nov 13-20, 2025.
Each score represents usage relative to what would be expected based on a country’s working-age population.
| Rank | Index score | |
|---|---|---|
| 1 |  Israel Israel |
4.90x |
| 2 |  Singapore Singapore |
4.19x |
| 3 |  United States United States |
3.69x |
| 4 |  Australia Australia |
3.27x |
| 5 |  Switzerland Switzerland |
3.21x |
| 6 |  Canada Canada |
3.15x |
| 7 |  South Korea South Korea |
3.12x |
| 8 |  New Zealand New Zealand |
3.11x |
| 9 |  Luxembourg Luxembourg |
3.07x |
| 10 |  Estonia Estonia |
3.05x |
| 11 |  France France |
2.66x |
| 12 |  Malta Malta |
2.63x |
| 13 |  The Netherlands The Netherlands |
2.61x |
| 14 |  United Kingdom United Kingdom |
2.59x |
| 15 |  Norway Norway |
2.43x |
| 16 |  Ireland Ireland |
2.39x |
| 17 |  Sweden Sweden |
2.29x |
| 18 |  Portugal Portugal |
2.23x |
| 19 |  Belgium Belgium |
2.17x |
| 20 |  Georgia Georgia |
2.17x |
| 21 |  Cyprus Cyprus |
2.15x |
| 22 |  Denmark Denmark |
2.10x |
| 23 |  Lithuania Lithuania |
2.09x |
| 24 |  Finland Finland |
1.95x |
| 25 |  Latvia Latvia |
1.92x |
| 26 |  Austria Austria |
1.88x |
| 27 |  Slovenia Slovenia |
1.85x |
| 28 |  Germany Germany |
1.79x |
| 29 |  Taiwan Taiwan |
1.77x |
| 30 |  Spain Spain |
1.62x |
| 31 |  Italy Italy |
1.62x |
| 32 |  United Arab Emirates United Arab Emirates |
1.61x |
| 33 |  Japan Japan |
1.59x |
| 34 |  Czechia Czechia |
1.54x |
| 35 |  Moldova Moldova |
1.47x |
| 36 |  Poland Poland |
1.41x |
| 37 |  Qatar Qatar |
1.39x |
| 38 |  Bulgaria Bulgaria |
1.33x |
| 39 |  Croatia Croatia |
1.31x |
| 40 |  Serbia Serbia |
1.24x |
| 41 |  Mauritius Mauritius |
1.24x |
| 42 |  Greece Greece |
1.21x |
| 43 |  Peru Peru |
1.19x |
| 44 |  Tunisia Tunisia |
1.14x |
| 45 |  Costa Rica Costa Rica |
1.12x |
| 46 |  Uruguay Uruguay |
1.10x |
| 47 |  Ukraine Ukraine |
1.09x |
| 48 |  Slovakia Slovakia |
1.08x |
| 49 |  North Macedonia North Macedonia |
1.08x |
| 50 |  Ecuador Ecuador |
1.05x |
| 51 |  Chile Chile |
1.04x |
| 52 |  Hungary Hungary |
0.98x |
| 53 |  Romania Romania |
0.98x |
| 54 |  Armenia Armenia |
0.97x |
| 55 |  Panama Panama |
0.95x |
| 56 |  Trinidad and Tobago Trinidad and Tobago |
0.93x |
| 57 |  Puerto Rico Puerto Rico |
0.92x |
| 58 |  Colombia Colombia |
0.88x |
| 59 |  Bahrain Bahrain |
0.85x |
| 60 |  Sri Lanka Sri Lanka |
0.82x |
| 61 |  Lebanon Lebanon |
0.78x |
| 62 |  Morocco Morocco |
0.76x |
| 63 |  Argentina Argentina |
0.75x |
| 64 |  Dominican Republic Dominican Republic |
0.74x |
| 65 |  Bolivia Bolivia |
0.71x |
| 66 |  Brazil Brazil |
0.70x |
| 67 |  Albania Albania |
0.68x |
| 68 |  Malaysia Malaysia |
0.66x |
| 69 |  Bosnia and Herzegovina Bosnia and Herzegovina |
0.60x |
| 70 |  Thailand Thailand |
0.59x |
| 71 |  Jamaica Jamaica |
0.56x |
| 72 |  Turkey Turkey |
0.56x |
| 73 |  Vietnam Vietnam |
0.56x |
| 74 |  Kazakhstan Kazakhstan |
0.56x |
| 75 |  Indonesia Indonesia |
0.48x |
| 76 |  Philippines Philippines |
0.48x |
| 77 |  Paraguay Paraguay |
0.47x |
| 78 |  El Salvador El Salvador |
0.47x |
| 79 |  Saudi Arabia Saudi Arabia |
0.45x |
| 80 |  Mexico Mexico |
0.44x |
| 81 |  Iraq Iraq |
0.43x |
| 82 |  Kenya Kenya |
0.43x |
| 83 |  South Africa South Africa |
0.38x |
| 84 |  Jordan Jordan |
0.37x |
| 85 |  Kuwait Kuwait |
0.37x |
| 86 |  Kyrgyzstan Kyrgyzstan |
0.35x |
| 87 |  Oman Oman |
0.35x |
| 88 |  Algeria Algeria |
0.34x |
| 89 |  Palestinian Territory Palestinian Territory |
0.32x |
| 90 |  Nepal Nepal |
0.32x |
| 91 |  Rwanda Rwanda |
0.30x |
| 92 |  Azerbaijan Azerbaijan |
0.29x |
| 93 |  Egypt Egypt |
0.28x |
| 94 |  Ghana Ghana |
0.27x |
| 95 |  Senegal Senegal |
0.27x |
| 96 |  Guatemala Guatemala |
0.26x |
| 97 |  Benin Benin |
0.25x |
| 98 |  Cameroon Cameroon |
0.23x |
| 99 |  Ivory Coast Ivory Coast |
0.23x |
| 100 |  Pakistan Pakistan |
0.22x |
| 101 |  India India |
0.22x |
| 102 |  Nigeria Nigeria |
0.22x |
| 103 |  Honduras Honduras |
0.21x |
| 104 |  Laos Laos |
0.20x |
| 105 |  Cambodia Cambodia |
0.19x |
| 106 |  Togo Togo |
0.17x |
| 107 |  Zimbabwe Zimbabwe |
0.15x |
| 108 |  Uzbekistan Uzbekistan |
0.13x |
| 109 |  Madagascar Madagascar |
0.13x |
| 110 |  Zambia Zambia |
0.11x |
| 111 |  Burkina Faso Burkina Faso |
0.10x |
| 112 |  Bangladesh Bangladesh |
0.09x |
| 113 |  Uganda Uganda |
0.09x |
| 114 |  Mozambique Mozambique |
0.07x |
| 115 |  Angola Angola |
0.05x |
| 116 |  Tanzania Tanzania |
0.03x |
Israel topped the Anthropic AI Usage Index at 4.9x, putting it well ahead of other countries. Israel has been labeled the “Start-up Nation” since a book of the same name charted its rapid growth and technological innovation.
Singapore has the second-highest uptake at 4.19x. The small city-state also performed well on last year’s Global Innovation Index, which ranks countries on research and entrepreneurship.
Because the index measures usage relative to workforce size, smaller tech-driven economies can rank highly even if their overall user base is smaller.
However, among countries with at least 10,000 conversations, the United States leads at 3.69x. It also dominates in share of actual usage, though raw usage numbers don’t necessarily equate to broad penetration, given that countries with larger populations would naturally rank higher.
Brazil ranks among the largest users of Claude in raw terms, but its score drops to 0.7x when adjusted for workforce size, showing how population size can inflate raw usage totals.
Asia fares well overall, as South Korea ranks among the top adopters per capita at 3.12x. Australia, Canada, and New Zealand occupy other top spots at 3.27x, 3.15x, and 3.11x respectively.
Most of the highest-ranking countries are in North America, Europe, Oceania, and parts of East Asia.
Malta and Georgia also made the top 20, with scores of 2.8x and 2.17x. Malta consistently punches above its weight as a European startup hub, despite being a tiny island in the Mediterranean, while efforts are underway to institutionalize AI use in Georgia.
At the bottom of the index were Tanzania and Angola, at 0.03x and 0.05x respectively.
Some smaller countries were not included due to an insufficient number of conversations over the observation period.
Uses For AI Vary
Claude usage also varies depending on economic conditions. In lower-income countries, the chatbot is commonly used for homework help and programming tasks, while wealthier countries show a broader mix of professional uses.
The dynamic could also reflect the ages of those using chatbots in different countries. In lower-income areas, there may be higher uptake among students.
Learn More on the Voronoi App
To learn more about how AI, check out this graphic which charts the rise of AI chatbots.