Mapped: Economies Most Dependent on Remittances
This was originally posted on our Voronoi app. Download the app for free on iOS or Android and discover incredible data-driven charts from a variety of trusted sources.
Key Takeaways
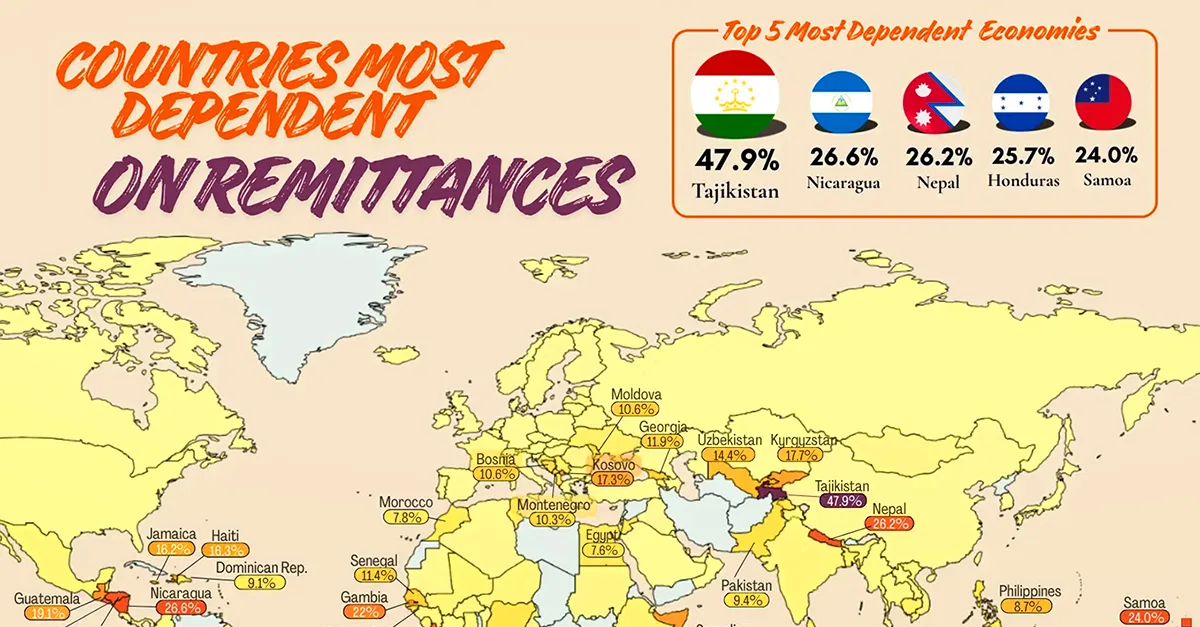
- Tajikistan is the world’s most remittance-dependent economy, with inflows equal to 47.9% of GDP in 2024.
- Several smaller economies rely on remittances for a quarter or more of GDP, including Nicaragua, Nepal, Honduras, and Samoa.
- By comparison, the global average is just 0.82%, showing how concentrated remittance dependence is.
In some economies, money sent home by workers abroad is not just helpful—it is a major pillar of national income. In Tajikistan, remittances were equal to 47.9% of GDP in 2024, the highest share in the world.
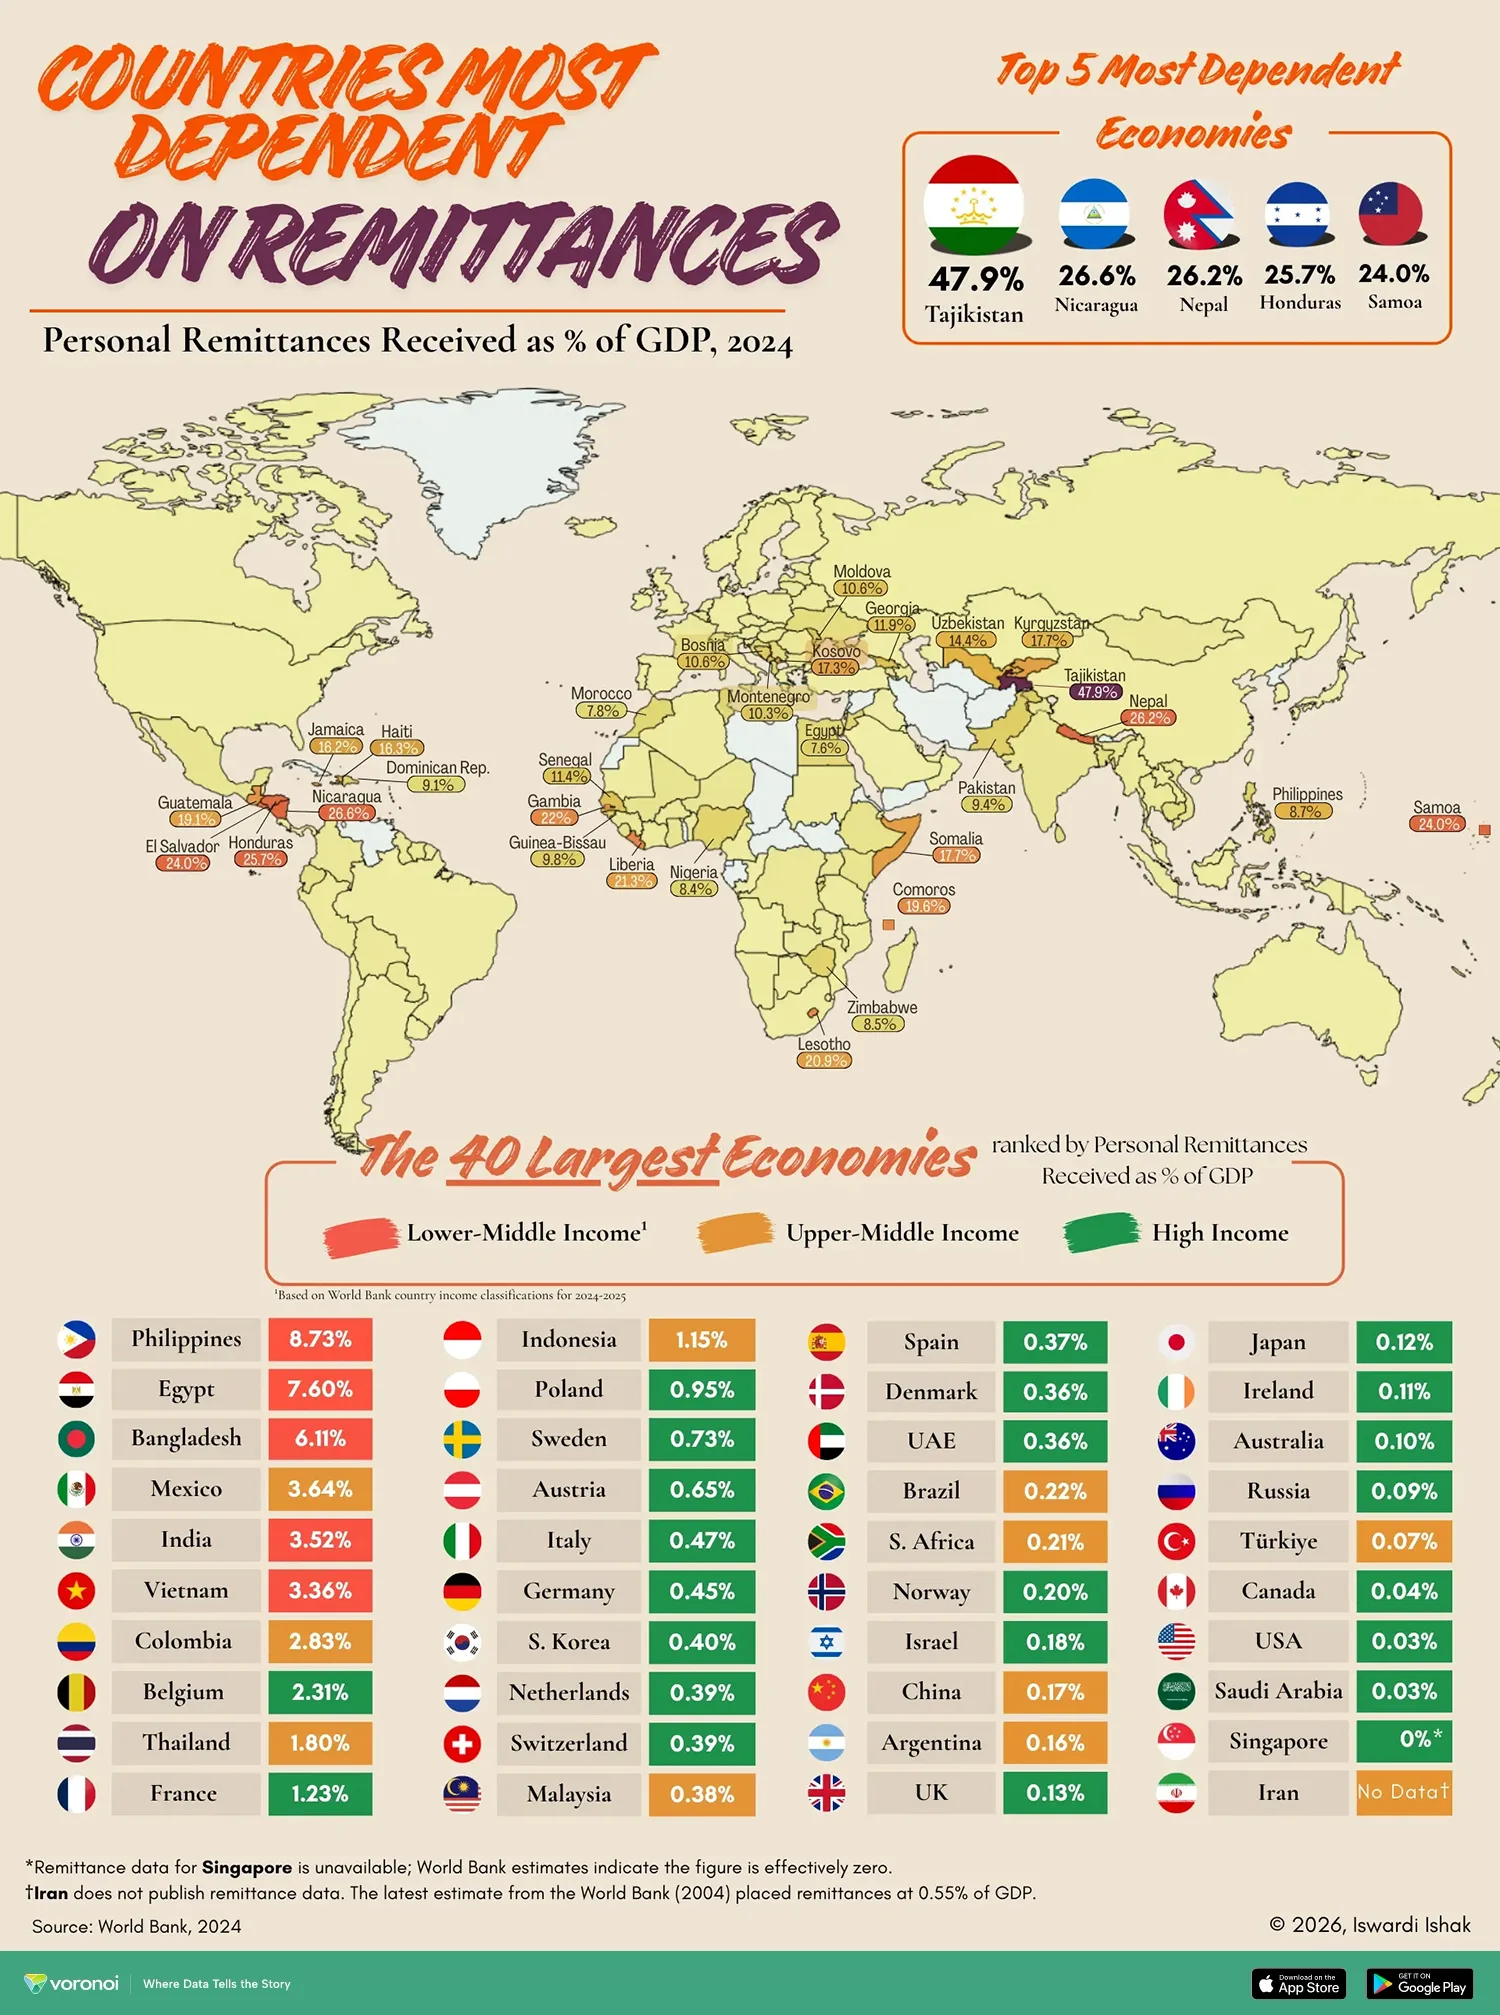
The visualization, created by Iswardi Ishak using World Bank data, maps personal remittances received as a share of GDP across 194 economies in 2024. It shows how migration-linked income plays an outsized role in a small group of countries, compared with a global average of just 0.82%.
Ranked: Where Remittances Make Up the Biggest Share
Tajikistan ranks far above every other economy, with remittances equal to 47.9% in 2024.
Nicaragua, Nepal, Honduras, and Samoa also stand out, each relying on these inflows for roughly a quarter of national output. Globally, the average is just 0.82%.
| Rank | Country | Remittances as a % of GDP (2024) |
|---|---|---|
| 1 |  Tajikistan Tajikistan |
47.89 |
| 2 |  Lebanon Lebanon |
33.35 |
| 3 |  Nicaragua Nicaragua |
26.64 |
| 4 |  Nepal Nepal |
26.23 |
| 5 |  Honduras Honduras |
25.70 |
| 6 |  Bermuda Bermuda |
25.41 |
| 7 |  Samoa Samoa |
24.01 |
| 8 |  El Salvador El Salvador |
24.00 |
| 9 |  Gambia, The Gambia, The |
22.00 |
| 10 |  Liberia Liberia |
21.28 |
| 11 |  Lesotho Lesotho |
20.94 |
| 12 |  Comoros Comoros |
19.60 |
| 13 |  Guatemala Guatemala |
19.12 |
| 14 |  Kyrgyz Republic Kyrgyz Republic |
17.74 |
| 15 |  Somalia, Fed. Rep. Somalia, Fed. Rep. |
17.70 |
| 16 |  Kosovo Kosovo |
17.30 |
| 17 |  Haiti Haiti |
16.30 |
| 18 |  Jamaica Jamaica |
16.19 |
| 19 |  Uzbekistan Uzbekistan |
14.42 |
| 20 |  Cabo Verde Cabo Verde |
12.25 |
| 21 |  Georgia Georgia |
11.87 |
| 22 |  Marshall Islands Marshall Islands |
11.87 |
| 23 |  Timor-Leste Timor-Leste |
11.77 |
| 24 |  Senegal Senegal |
11.43 |
| 25 |  Bosnia and Herzegovina Bosnia and Herzegovina |
10.55 |
| 26 |  Moldova Moldova |
10.54 |
| 27 |  Montenegro Montenegro |
10.34 |
| 28 |  Guinea-Bissau Guinea-Bissau |
9.79 |
| 29 |  Sao Tome and Principe Sao Tome and Principe |
9.75 |
| 30 |  Pakistan Pakistan |
9.40 |
| 31 |  French Polynesia French Polynesia |
9.20 |
| 32 |  Dominican Republic Dominican Republic |
9.05 |
| 33 |  Philippines Philippines |
8.73 |
| 34 |  Zimbabwe Zimbabwe |
8.45 |
| 35 |  Nigeria Nigeria |
8.44 |
| 36 |  Albania Albania |
8.41 |
| 37 |  Jordan Jordan |
8.31 |
| 38 |  St. Vincent and the Grenadines St. Vincent and the Grenadines |
7.94 |
| 39 |  Morocco Morocco |
7.79 |
| 40 |  Burundi Burundi |
7.69 |
| 41 |  Egypt, Arab Rep. Egypt, Arab Rep. |
7.60 |
| 42 |  New Caledonia New Caledonia |
7.26 |
| 43 |  Croatia Croatia |
7.21 |
| 44 |  Fiji Fiji |
7.11 |
| 45 |  Sri Lanka Sri Lanka |
6.79 |
| 46 |  Serbia Serbia |
6.40 |
| 47 |  Tunisia Tunisia |
6.34 |
| 48 |  Ukraine Ukraine |
6.29 |
| 49 |  Bangladesh Bangladesh |
6.11 |
| 50 |  Cambodia Cambodia |
6.10 |
| 51 |  Solomon Islands Solomon Islands |
6.01 |
| 52 |  Dominica Dominica |
5.67 |
| 53 |  West Bank and Gaza West Bank and Gaza |
5.37 |
| 54 |  Ecuador Ecuador |
5.25 |
| 55 |  Micronesia, Fed. Sts. Micronesia, Fed. Sts. |
4.95 |
| 56 |  Armenia Armenia |
4.92 |
| 57 |  Belize Belize |
4.81 |
| 58 |  Ethiopia Ethiopia |
4.77 |
| 59 |  Kiribati Kiribati |
4.76 |
| 60 |  Sierra Leone Sierra Leone |
4.60 |
| 61 |  Kenya Kenya |
4.15 |
| 62 |  Mali Mali |
3.99 |
| 63 |  Ghana Ghana |
3.68 |
| 64 |  Mexico Mexico |
3.64 |
| 65 |  Rwanda Rwanda |
3.63 |
| 66 |  Suriname Suriname |
3.63 |
| 67 |  India India |
3.52 |
| 68 |  Grenada Grenada |
3.50 |
| 69 |  St. Kitts and Nevis St. Kitts and Nevis |
3.45 |
| 70 |  Vietnam Vietnam |
3.36 |
| 71 |  Niger Niger |
3.27 |
| 72 |  Curacao Curacao |
3.26 |
| 73 |  Latvia Latvia |
3.06 |
| 74 |  Colombia Colombia |
2.83 |
| 75 |  Congo, Dem. Rep. Congo, Dem. Rep. |
2.82 |
| 76 |  North Macedonia North Macedonia |
2.70 |
| 77 |  Sint Maarten (Dutch part) Sint Maarten (Dutch part) |
2.69 |
| 78 |  Luxembourg Luxembourg |
2.68 |
| 79 |  Uganda Uganda |
2.65 |
| 80 |  Paraguay Paraguay |
2.56 |
| 81 |  Burkina Faso Burkina Faso |
2.55 |
| 82 |  Romania Romania |
2.49 |
| 83 |  Guinea Guinea |
2.46 |
| 84 |  Hungary Hungary |
2.46 |
| 85 |  Guyana Guyana |
2.43 |
| 86 |  St. Lucia St. Lucia |
2.38 |
| 87 |  Bolivia Bolivia |
2.34 |
| 88 |  Bulgaria Bulgaria |
2.33 |
| 89 |  Madagascar Madagascar |
2.33 |
| 90 |  Belgium Belgium |
2.31 |
| 91 |  Mongolia Mongolia |
2.22 |
| 92 |  Slovakia Slovakia |
2.10 |
| 93 |  Cote d’Ivoire Cote d’Ivoire |
2.03 |
| 94 |  Mauritius Mauritius |
1.92 |
| 95 |  Azerbaijan Azerbaijan |
1.82 |
| 96 |  Belarus Belarus |
1.81 |
| 97 |  Sudan Sudan |
1.81 |
| 98 |  Cyprus Cyprus |
1.80 |
| 99 |  Thailand Thailand |
1.80 |
| 100 |  Peru Peru |
1.71 |
| 101 |  Malawi Malawi |
1.65 |
| 102 |  Myanmar Myanmar |
1.55 |
| 103 |  Lao PDR Lao PDR |
1.49 |
| 104 |  Tanzania Tanzania |
1.42 |
| 105 |  Nauru Nauru |
1.37 |
| 106 |  Djibouti Djibouti |
1.35 |
| 107 |  Zambia Zambia |
1.32 |
| 108 |  Andorra Andorra |
1.30 |
| 109 |  Cameroon Cameroon |
1.29 |
| 110 |  Lithuania Lithuania |
1.24 |
| 111 |  Slovenia Slovenia |
1.24 |
| 112 |  France France |
1.23 |
| 113 |  Czechia Czechia |
1.22 |
| 114 |  Antigua and Barbuda Antigua and Barbuda |
1.19 |
| 115 |  Mozambique Mozambique |
1.17 |
| 116 |  Estonia Estonia |
1.15 |
| 117 |  Indonesia Indonesia |
1.15 |
| 118 |  Barbados Barbados |
1.14 |
| 119 |  Benin Benin |
1.10 |
| 120 |  Poland Poland |
0.95 |
| 121 |  Aruba Aruba |
0.89 |
| 122 |  Mauritania Mauritania |
0.87 |
| 123 |  European Union European Union |
0.81 |
| 124 |  Trinidad and Tobago Trinidad and Tobago |
0.78 |
| 125 |  Costa Rica Costa Rica |
0.76 |
| 126 |  Iceland Iceland |
0.74 |
| 127 |  Sweden Sweden |
0.73 |
| 128 |  Namibia Namibia |
0.72 |
| 129 |  Eswatini Eswatini |
0.69 |
| 130 |  Algeria Algeria |
0.67 |
| 131 |  Botswana Botswana |
0.66 |
| 132 |  Qatar Qatar |
0.66 |
| 133 |  Austria Austria |
0.65 |
| 134 |  Panama Panama |
0.61 |
| 135 |  Portugal Portugal |
0.59 |
| 136 |  Seychelles Seychelles |
0.55 |
| 137 |  Italy Italy |
0.47 |
| 138 |  Germany Germany |
0.45 |
| 139 |  Bahamas, The Bahamas, The |
0.42 |
| 140 |  Korea, Rep. Korea, Rep. |
0.40 |
| 141 |  Switzerland Switzerland |
0.39 |
| 142 |  Netherlands Netherlands |
0.39 |
| 143 |  Malaysia Malaysia |
0.38 |
| 144 |  Spain Spain |
0.37 |
| 145 |  Denmark Denmark |
0.36 |
| 146 |  United Arab Emirates United Arab Emirates |
0.33 |
| 147 |  Congo, Rep. Congo, Rep. |
0.28 |
| 148 |  Macao SAR Macao SAR |
0.27 |
| 149 |  Finland Finland |
0.25 |
| 150 |  Iraq Iraq |
0.25 |
| 151 |  New Zealand New Zealand |
0.23 |
| 152 |  Brazil Brazil |
0.22 |
| 153 |  Greece Greece |
0.22 |
| 154 |  South Africa South Africa |
0.21 |
| 155 |  Norway Norway |
0.20 |
| 156 |  Israel Israel |
0.18 |
| 157 |  China China |
0.17 |
| 158 |  Uruguay Uruguay |
0.17 |
| 159 |  Argentina Argentina |
0.16 |
| 160 |  United Kingdom United Kingdom |
0.13 |
| 161 |  Japan Japan |
0.12 |
| 162 |  Hong Kong SAR Hong Kong SAR |
0.11 |
| 163 |  Ireland Ireland |
0.11 |
| 164 |  Australia Australia |
0.10 |
| 165 |  Russian Federation Russian Federation |
0.09 |
| 166 |  Kazakhstan Kazakhstan |
0.08 |
| 167 |  Maldives Maldives |
0.08 |
| 168 |  Turkiye Turkiye |
0.07 |
| 169 |  Malta Malta |
0.06 |
| 170 |  Angola Angola |
0.05 |
| 171 |  Canada Canada |
0.04 |
| 172 |  Oman Oman |
0.04 |
| 173 |  Chile Chile |
0.03 |
| 174 |  Saudi Arabia Saudi Arabia |
0.03 |
| 175 |  United States United States |
0.03 |
| 176 |  Kuwait Kuwait |
0.01 |
| 177 |  Papua New Guinea Papua New Guinea |
0.01 |
| — |  Togo Togo |
8.69 (2020) |
| — |  Tonga Tonga |
42.61 (2023) |
| — |  Tuvalu Tuvalu |
4.16 (2023) |
| — |  Bhutan Bhutan |
3.58 (2023) |
| — |  Syrian Arab Republic Syrian Arab Republic |
2.64 (2010) |
| — |  Vanuatu Vanuatu |
18.75 (2022) |
| — |  Yemen, Rep. Yemen, Rep. |
15.89 (2018) |
| — |  Afghanistan Afghanistan |
1.87 (2023) |
| — |  San Marino San Marino |
1.10 (2023) |
| — |  Palau Palau |
0.80 (2023) |
| — |  Turks and Caicos Islands Turks and Caicos Islands |
0.57 (2018) |
| — |  Iran, Islamic Rep. Iran, Islamic Rep. |
0.55 (2004) |
| — |  Venezuela, RB Venezuela, RB |
0.25 (2016) |
| — |  Cayman Islands Cayman Islands |
0.15 (2023) |
| — |  Gabon Gabon |
0.13 (2015) |
| — |  Libya Libya |
0.03 (2006) |
| — | Iran, Islamic Rep. |
No Data |
| — |  World World |
0.82 |
Why Some Economies Depend More on Remittances
Remittance dependence is highest in smaller or lower-income economies where a significant share of the workforce migrates abroad. The money sent home supports household spending, education, housing, and basic consumption, giving remittances an outsized role in the domestic economy.
This reliance can be a double-edged sword. While remittances are often more stable than foreign investment during downturns, countries that depend on them are more exposed to changes in host-country labor markets, migration policy, and transfer costs.
Big Economies, Smaller Shares
Interestingly, some of the world’s largest recipients of remittances, like India, Mexico, and the Philippines, do not rank as highly when measured as a share of GDP. For example:
- India receives massive inflows in absolute terms but remittances account for just 3.5% of GDP.
- Mexico sees a similar pattern, with 3.6% of GDP tied to remittances.
- The Philippines stands higher at 8.7%, reflecting a more migration-driven economy.
Simply put: large economies have more diversified sources of income, diluting the relative impact of remittances.
The Cost of Sending Money Home
Despite their importance, remittances can come with high transaction costs. In fact, some countries face the highest remittance fees globally, reducing the amount families ultimately receive.
Lowering these costs remains a key goal for policymakers and international organizations, as even small reductions can significantly boost household income in remittance-dependent nations.
Learn More on the Voronoi App 
To explore how money moves across borders, check out Global Remittance Flows on the Voronoi app.