America’s Most-Spoken Languages After English and Spanish
See visuals like this from many other data creators on our Voronoi app. Download it for free on iOS or Android and discover data-driven charts from a variety of trusted sources.
Key Takeaways
- Chinese is the top non-English, non-Spanish language in 13 states, including California, New York, and Georgia.
- German still dominates parts of the Plains and Mountain West more than a century after peak German immigration.
- Indigenous and immigrant languages alike remain regionally concentrated, from Navajo in the Southwest to Vietnamese across the South and Plains.
America’s linguistic map looks very different once English and Spanish are removed.
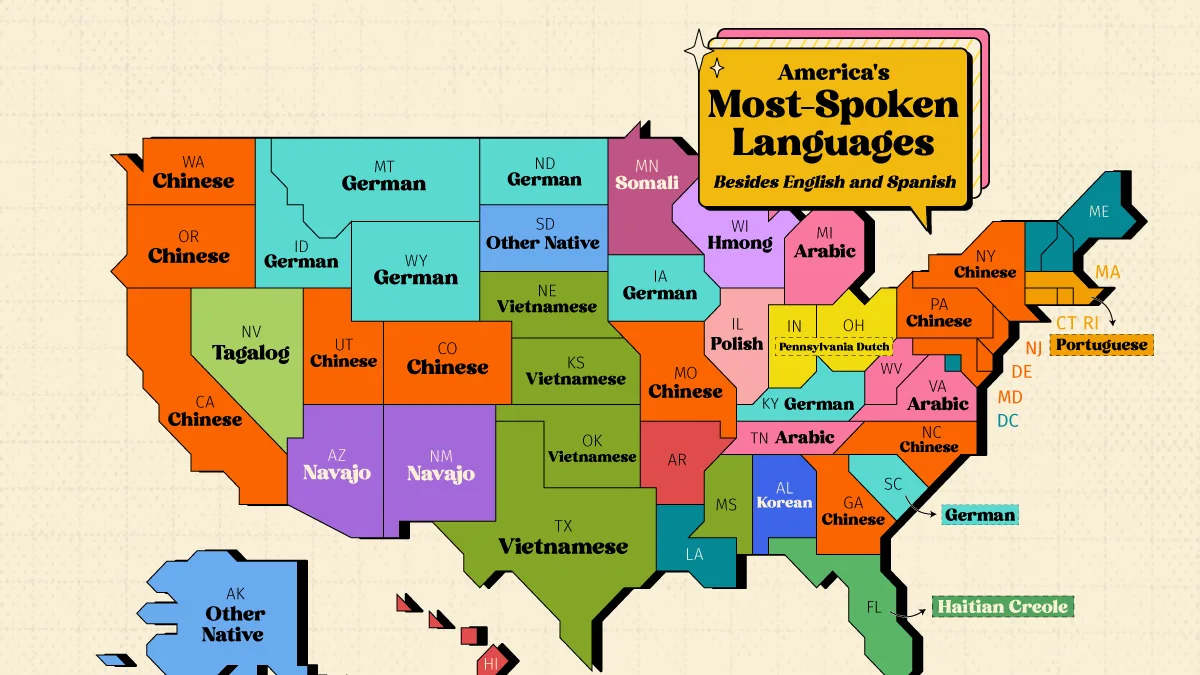
This map shows the most-spoken language in every U.S. state after English and Spanish, based on U.S. Census Bureau American Community Survey data from 2020–2024.
From Chinese in New York and California to Navajo in the Southwest, the results reveal how immigration, Indigenous communities, and regional history continue to shape the country.
Chinese Dominates Coastal and Tech-Hub States
Chinese is the dominant non-English, non-Spanish language across 13 states, giving it the widest geographic footprint of any language on the map.
The concentration is especially visible in coastal states and fast-growing Sun Belt economies with large technology and business sectors.
California alone has more than 1.2 million Chinese speakers, while New York has more than 600,000.
| State | #2 Language |
|---|---|
| Minnesota | Amharic/Somali & Afro-Asiatic |
| Michigan | Arabic |
| Tennessee | Arabic |
| Virginia | Arabic |
| West Virginia | Arabic |
| California | Chinese (Mandarin/Cantonese) |
| Colorado | Chinese (Mandarin/Cantonese) |
| Delaware | Chinese (Mandarin/Cantonese) |
| Georgia | Chinese (Mandarin/Cantonese) |
| Maryland | Chinese (Mandarin/Cantonese) |
| Missouri | Chinese (Mandarin/Cantonese) |
| New Jersey | Chinese (Mandarin/Cantonese) |
| New York | Chinese (Mandarin/Cantonese) |
| North Carolina | Chinese (Mandarin/Cantonese) |
| Oregon | Chinese (Mandarin/Cantonese) |
| Pennsylvania | Chinese (Mandarin/Cantonese) |
| Utah | Chinese (Mandarin/Cantonese) |
| Washington | Chinese (Mandarin/Cantonese) |
| District of Columbia | French |
| Louisiana | French |
| Maine | French |
| New Hampshire | French |
| Vermont | French |
| Idaho | German |
| Iowa | German |
| Kentucky | German |
| Montana | German |
| North Dakota | German |
| South Carolina | German |
| Wyoming | German |
| Florida | Haitian Creole |
| Wisconsin | Hmong |
| Arkansas | Ilocano/Samoan/Hawaiian & Austronesian |
| Hawaii | Ilocano/Samoan/Hawaiian & Austronesian |
| Alabama | Korean |
| Arizona | Navajo |
| New Mexico | Navajo |
| Alaska | Other Native (North America) |
| South Dakota | Other Native (North America) |
| Illinois | Polish |
| Connecticut | Portuguese |
| Massachusetts | Portuguese |
| Rhode Island | Portuguese |
| Nevada | Tagalog/Filipino |
| Kansas | Vietnamese |
| Mississippi | Vietnamese |
| Nebraska | Vietnamese |
| Oklahoma | Vietnamese |
| Texas | Vietnamese |
| Indiana | Yiddish/PA Dutch & W. Germanic |
| Ohio | Yiddish/PA Dutch & W. Germanic |
These communities reflect both modern immigration patterns and more than 150 years of Chinese-American settlement history dating back to the 19th century.
German’s Historic Footprint Remains Visible
German remains the most-spoken non-English, non-Spanish language across several Plains and Mountain West states, including Montana, Wyoming, Idaho, Iowa, and North Dakota.
This reflects the legacy of large-scale German immigration during the late 1800s, when German became the country’s largest non-English language. That influence declined sharply following anti-German sentiment during World War I and immigration restrictions introduced in the 1920s.
Regional Language Clusters Reflect Migration Patterns
Beyond Chinese and German, the map reveals several distinct regional language corridors across the United States.
French remains prominent in Maine, Vermont, New Hampshire, Louisiana, and Washington, D.C., reflecting both Quebec-border heritage and Francophone migration.
Vietnamese leads across Texas, Oklahoma, Nebraska, Kansas, and Mississippi, while Portuguese ranks first among non-English, non-Spanish languages in Massachusetts, Rhode Island, and Connecticut.
Elsewhere, Navajo remains the leading language category in Arizona and New Mexico, highlighting the enduring presence of Indigenous communities in the Southwest.
Meanwhile, Alaska and South Dakota also stand out for their large populations speaking Indigenous North American languages.
Learn More on the Voronoi App 
If you enjoyed today’s post, check out The World’s Most Spoken Languages by Total Speakers on Voronoi, the new app from Visual Capitalist.Use This Visualization
- Source: https://www.visualcapitalist.com/mapped-americas-most-spoken-languages-after-english-and-spanish/