Mapped: AI Adoption by Country in 2026
See visuals like this from many other data creators on our Voronoi app. Download it for free on iOS or Android and discover incredible data-driven charts from a variety of trusted sources.
Key Takeaways
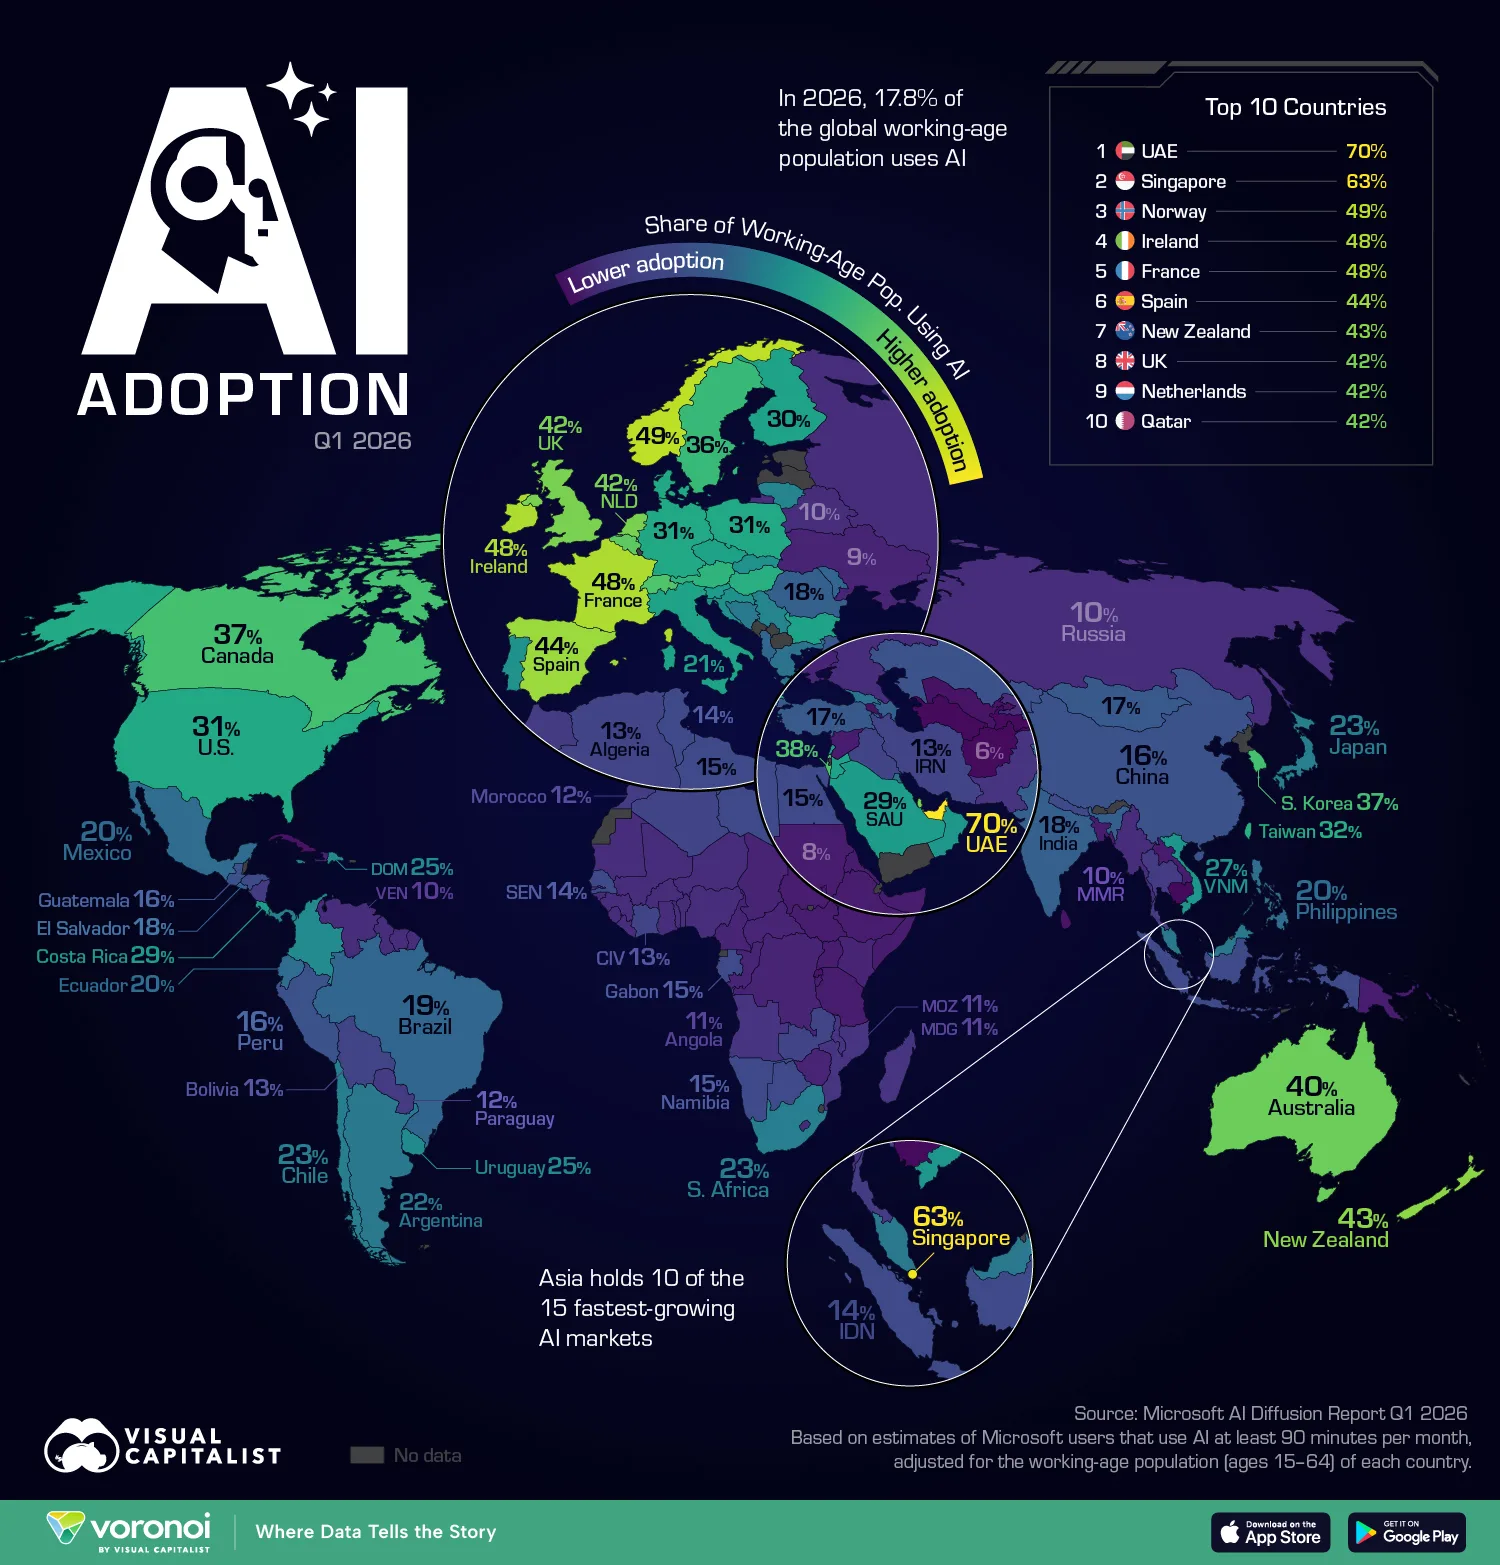
- The UAE leads global AI usage, with 70% of working-age adults regularly using AI tools.
- Singapore ranks second at 63%, while the U.S. trails more than 20 countries despite leading AI development.
- Europe accounts for 11 of the world’s top 20 AI adoption markets.
AI may be dominated by American companies, but the countries using it the most are much smaller economies.
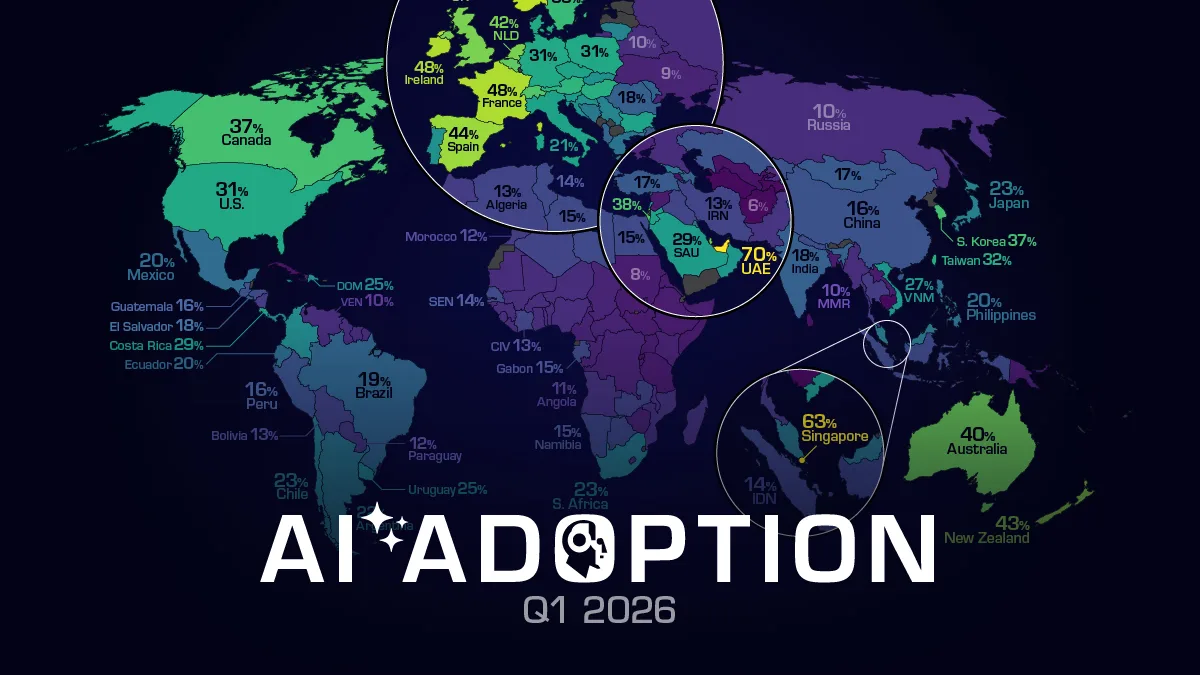
This map shows the share of each country’s working-age population using AI tools in Q1 2026, based on Microsoft estimates of users engaging with AI for at least 90 minutes per month. Globally, 17.8% of working-age adults now use AI regularly.
The UAE leads the world by a wide margin, with more than 70% adoption, followed by Singapore at 63%. Meanwhile, the U.S. ranks outside the global top 20 despite being home to many of the world’s leading AI firms.
Europe also emerges as a major AI adoption hub, with countries including Norway, Ireland, France, Spain, and the Netherlands all posting usage rates above 40%.
Smaller Economies Are Winning the AI Race
The rankings suggest that building the world’s leading AI models does not automatically translate into widespread everyday usage.
Smaller economies like the UAE and Singapore have moved faster to integrate AI across business, education, and government services through centralized digital strategies and heavy infrastructure investment.
| Rank (2026) | Country | Q1 2026 | H1 2025 |
|---|---|---|---|
| 1 |  UAE UAE |
70.1% | 59.4% |
| 2 |  Singapore Singapore |
63.4% | 58.6% |
| 3 |  Norway Norway |
48.6% | 45.3% |
| 4 |  Ireland Ireland |
48.4% | 41.7% |
| 5 |  France France |
47.8% | 40.9% |
| 6 |  Spain Spain |
44.2% | 39.7% |
| 7 |  New Zealand New Zealand |
43.0% | 37.6% |
| 8 |  UK UK |
42.2% | 36.4% |
| 9 |  Netherlands Netherlands |
42.1% | 36.3% |
| 10 |  Qatar Qatar |
41.8% | 35.7% |
| 11 |  Australia Australia |
39.5% | 34.5% |
| 12 |  Belgium Belgium |
39.0% | 33.5% |
| 13 |  Israel Israel |
38.1% | 33.9% |
| 14 |  Switzerland Switzerland |
37.8% | 32.4% |
| 15 |  Canada Canada |
37.3% | 33.5% |
| 16 |  South Korea South Korea |
37.1% | 25.9% |
| 17 |  Sweden Sweden |
36.1% | 31.2% |
| 18 |  Austria Austria |
34.1% | 29.1% |
| 19 |  Hungary Hungary |
32.2% | 27.9% |
| 20 |  Taiwan Taiwan |
31.8% | 26.4% |
| 21 |  U.S. U.S. |
31.3% | 26.3% |
| 22 |  Denmark Denmark |
31.2% | 26.6% |
| 23 |  Germany Germany |
31.1% | 26.5% |
| 24 |  Poland Poland |
31.0% | 26.4% |
| 25 |  Italy Italy |
30.2% | 25.8% |
| 26 |  Czechia Czechia |
30.1% | 26.0% |
| 27 |  Jordan Jordan |
29.7% | 25.4% |
| 28 |  Bulgaria Bulgaria |
29.7% | 25.4% |
| 29 |  Finland Finland |
29.5% | 25.6% |
| 30 |  Saudi Arabia Saudi Arabia |
29.4% | 23.7% |
| 31 |  Slovenia Slovenia |
29.0% | 24.6% |
| 32 |  Costa Rica Costa Rica |
28.5% | 25.1% |
| 33 |  Lebanon Lebanon |
27.3% | 24.8% |
| 34 |  Vietnam Vietnam |
26.5% | 21.2% |
| 35 |  Oman Oman |
26.5% | 22.6% |
| 36 |  Portugal Portugal |
26.4% | 22.4% |
| 37 |  Croatia Croatia |
26.1% | 21.8% |
| 38 |  Slovakia Slovakia |
26.1% | 22.1% |
| 39 |  Dominican Republic Dominican Republic |
24.8% | 22.0% |
| 40 |  Uruguay Uruguay |
24.6% | 20.9% |
| 41 |  Colombia Colombia |
24.5% | 20.4% |
| 42 |  Lithuania Lithuania |
24.3% | 21.0% |
| 43 |  Serbia Serbia |
24.1% | 19.7% |
| 44 |  Jamaica Jamaica |
24.0% | 22.2% |
| 45 |  Panama Panama |
23.3% | 20.3% |
| 46 |  South Africa South Africa |
23.1% | 19.3% |
| 47 |  Chile Chile |
22.7% | 19.6% |
| 48 |  Japan Japan |
22.5% | 16.7% |
| 49 |  Bosnia And Herzegovina Bosnia And Herzegovina |
22.1% | 18.2% |
| 50 |  Argentina Argentina |
21.9% | 17.8% |
| 51 |  Malaysia Malaysia |
21.8% | 18.3% |
| 52 |  Kuwait Kuwait |
21.1% | 17.7% |
| 53 |  Greece Greece |
20.8% | 17.7% |
| 54 |  Georgia Georgia |
20.5% | 17.3% |
| 55 |  Mexico Mexico |
20.1% | 16.7% |
| 56 |  Philippines Philippines |
20.1% | 17.1% |
| 57 |  Ecuador Ecuador |
19.5% | 17.0% |
| 58 |  Brazil Brazil |
19.1% | 15.6% |
| 59 |  Albania Albania |
18.5% | 15.8% |
| 60 |  Moldova Moldova |
18.5% | 16.6% |
| 61 |  El Salvador El Salvador |
18.3% | 14.6% |
| 62 |  Azerbaijan Azerbaijan |
17.7% | 14.2% |
| 63 |  India India |
17.6% | 14.2% |
| 64 |  Romania Romania |
17.5% | 15.3% |
| 65 |  Turkey Turkey |
17.4% | 13.4% |
| 66 |  Mongolia Mongolia |
16.7% | 12.6% |
| 67 |  Guatemala Guatemala |
16.4% | 13.7% |
| 68 |  Peru Peru |
16.4% | 13.4% |
| 69 |  China China |
16.4% | 15.4% |
| 70 |  Kazakhstan Kazakhstan |
15.9% | 12.7% |
| 71 |  Namibia Namibia |
15.1% | 13.0% |
| 72 |  Gabon Gabon |
15.0% | 12.3% |
| 73 |  Libya Libya |
15.0% | 12.7% |
| 74 |  Egypt Egypt |
14.8% | 12.5% |
| 75 |  Botswana Botswana |
14.8% | 12.8% |
| 76 |  Nepal Nepal |
14.2% | 12.3% |
| 77 |  Indonesia Indonesia |
14.1% | 11.7% |
| 78 |  Honduras Honduras |
14.0% | 12.4% |
| 79 |  Senegal Senegal |
13.9% | 12.4% |
| 80 |  Tunisia Tunisia |
13.5% | 12.3% |
| 81 |  Algeria Algeria |
13.2% | 11.3% |
| 82 |  Zambia Zambia |
13.1% | 11.7% |
| 83 |  Cote D’Ivoire Cote D’Ivoire |
13.1% | 10.8% |
| 84 |  Bolivia Bolivia |
12.7% | 10.9% |
| 85 |  Iran Iran |
12.6% | 9.6% |
| 86 |  Iraq Iraq |
12.5% | 10.3% |
| 87 |  Thailand Thailand |
12.4% | 9.1% |
| 88 |  Paraguay Paraguay |
12.2% | 10.1% |
| 89 |  Nicaragua Nicaragua |
11.8% | 10.0% |
| 90 |  Morocco Morocco |
11.7% | 10.5% |
| 91 |  Gambia Gambia |
11.4% | 10.6% |
| 92 |  Pakistan Pakistan |
11.4% | 9.7% |
| 93 |  Angola Angola |
10.9% | 8.9% |
| 94 |  Madagascar Madagascar |
10.9% | 8.9% |
| 95 |  Malawi Malawi |
10.9% | 8.9% |
| 96 |  Mozambique Mozambique |
10.9% | 8.9% |
| 97 |  French Guiana French Guiana |
10.3% | 8.3% |
| 98 |  Guyana Guyana |
10.3% | 8.3% |
| 99 |  Suriname Suriname |
10.3% | 8.3% |
| 100 |  Venezuela Venezuela |
10.3% | 8.3% |
| 101 |  Benin Benin |
10.1% | 8.7% |
| 102 |  Burkina Faso Burkina Faso |
10.1% | 8.7% |
| 103 |  Ghana Ghana |
10.1% | 8.7% |
| 104 |  Guinea Guinea |
10.1% | 8.7% |
| 105 |  Guinea-Bissau Guinea-Bissau |
10.1% | 8.7% |
| 106 |  Liberia Liberia |
10.1% | 8.7% |
| 107 |  Mali Mali |
10.1% | 8.7% |
| 108 |  Mauritania Mauritania |
10.1% | 8.7% |
| 109 |  Niger Niger |
10.1% | 8.7% |
| 110 |  Nigeria Nigeria |
10.1% | 8.7% |
| 111 |  Sierra Leone Sierra Leone |
10.1% | 8.7% |
| 112 |  Myanmar Myanmar |
10.0% | 8.4% |
| 113 |  Lesotho Lesotho |
9.8% | 8.8% |
| 114 |  Belarus Belarus |
9.6% | 7.6% |
| 115 |  Kyrgyzstan Kyrgyzstan |
9.5% | 7.6% |
| 116 |  Russia Russia |
9.5% | 7.6% |
| 117 |  Ukraine Ukraine |
9.4% | 9.1% |
| 118 |  Kenya Kenya |
8.7% | 7.8% |
| 119 |  Cameroon Cameroon |
8.7% | 7.0% |
| 120 |  Central African Republic Central African Republic |
8.7% | 7.0% |
| 121 |  Chad Chad |
8.7% | 7.0% |
| 122 |  Congo Congo |
8.7% | 7.0% |
| 123 |  Democratic Republic Of The Congo Democratic Republic Of The Congo |
8.7% | 7.0% |
| 124 |  Zimbabwe Zimbabwe |
8.5% | 6.9% |
| 125 |  Haiti Haiti |
8.5% | 7.1% |
| 126 |  Laos Laos |
7.8% | 6.0% |
| 127 |  Bangladesh Bangladesh |
7.8% | 6.5% |
| 128 |  Papua New Guinea Papua New Guinea |
7.7% | 7.2% |
| 129 |  Burundi Burundi |
7.6% | 6.4% |
| 130 |  Eritrea Eritrea |
7.6% | 6.4% |
| 131 |  Ethiopia Ethiopia |
7.6% | 6.4% |
| 132 |  Somalia Somalia |
7.6% | 6.4% |
| 133 |  South Sudan South Sudan |
7.6% | 6.4% |
| 134 |  Sudan Sudan |
7.6% | 6.4% |
| 135 |  Tanzania Tanzania |
7.6% | 6.4% |
| 136 |  Uganda Uganda |
7.6% | 6.4% |
| 137 |  Syria Syria |
7.5% | 6.7% |
| 138 |  Armenia Armenia |
7.4% | 6.2% |
| 139 |  Sri Lanka Sri Lanka |
7.3% | 6.2% |
| 140 |  Rwanda Rwanda |
7.2% | 6.0% |
| 141 |  Uzbekistan Uzbekistan |
7.2% | 5.7% |
| 142 |  Cuba Cuba |
6.7% | 5.7% |
| 143 |  Afghanistan Afghanistan |
6.1% | 5.1% |
| 144 |  Tajikistan Tajikistan |
6.1% | 5.1% |
| 145 |  Turkmenistan Turkmenistan |
6.1% | 5.1% |
| 146 |  Cambodia Cambodia |
5.7% | 4.6% |
Europe’s strong performance also reflects widespread enterprise digitization, advanced broadband infrastructure, and highly digital workforces.
By contrast, many emerging economies remain in the early stages of adoption, creating a widening global AI gap that could reshape productivity and economic competitiveness over the next decade.
America Leads AI Development, Not Usage
At 31.3%, the U.S. trails 20 other countries in AI adoption despite leading the world in AI investment and infrastructure.
One reason is scale. Rolling out AI tools across a massive workforce is far more difficult than in smaller, digitally centralized economies like Singapore or the UAE. But the rankings also suggest that building the world’s best AI models does not automatically translate into widespread everyday usage.
The data also highlights a growing divide between building AI and actually using it. While America dominates AI model development, chip design, and venture funding, several smaller economies are integrating AI into everyday work at a faster pace.
AI adoption is also highly uneven across the country. Regions with dense tech ecosystems and high concentrations of digital talent are seeing significantly stronger usage rates than less digitized states. One separate study found that 22.4% of workers in Washington state use AI, compared with just 13.1% in South Dakota.
Asia Is Becoming the Fastest-Growing AI Region
Asia already accounts for 10 of the world’s 15 fastest-growing AI markets, according to Microsoft’s data.
AI usage in South Korea increased 43.2% between the first half of 2025 and Q1 2026, the largest increase globally. Thailand (36.2%), Japan (34.1%), and Mongolia (32.2%) are also seeing rapid adoption. By comparison, U.S. growth increased 19% over the period.
The surge also reflects major improvements in non-English AI performance, making AI tools far more useful across Asian markets over the past year. The region is also investing heavily in digital infrastructure.
China remains relatively low at 16%, but its scale means even modest increases in adoption could rapidly add hundreds of millions of new AI users. Like the U.S., it plays a leading role in AI model performance, particularly in open-source models, yet actual adoption remains lower than many regional peers.
AI Adoption Could Deepen the Next Economic Divide
The map highlights a growing global split between countries rapidly integrating AI and those still lagging behind.
Higher-adoption economies tend to share several traits: strong internet infrastructure, service-heavy economies, high digital literacy, and significant investment in cloud computing and AI education.
Meanwhile, lower-income regions across Africa and parts of South Asia continue to face barriers including internet access, device affordability, and limited enterprise AI integration.
As AI becomes more embedded in everyday work, adoption gaps could increasingly shape which countries gain the biggest productivity and economic advantages over the next decade, similar to how internet adoption reshaped global competitiveness in the early digital era.
Learn More on the Voronoi App 
To learn more about this topic, check out this graphic on memory chip makers by market cap.