Ranked: The World’s Largest Agricultural Economies
Key Takeaways
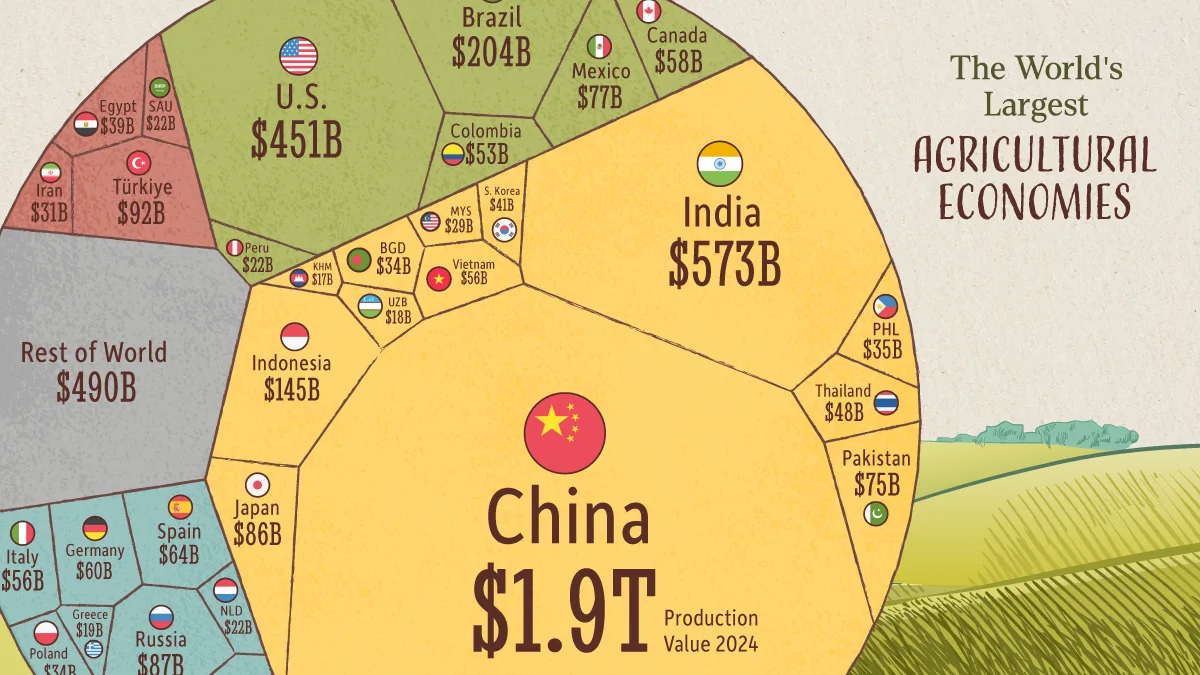
- China is the world’s largest agricultural economy, generating $1.9 trillion in production value, or 36% of the global total.
- India ranks second at $573 billion, followed by the U.S. ($451 billion) and Brazil ($204 billion).
- Together, the top four countries account for nearly 60% of global agricultural production value.
Global agriculture generated $5.2 trillion in production value in 2024, making it one of the world’s largest industries.
This graphic ranks the world’s largest agricultural economies by production value, based on data from the UN Food and Agriculture Organization (FAO).
China Outproduces the Next Three Combined
China generated $1.9 trillion in agricultural production in 2024, accounting for 36% of the global total. To put that in perspective, China’s agricultural economy is larger than those of India, the U.S., and Brazil combined, the next three largest producers in the world.
| Rank | Country | Agricultural Production Value 2024 |
Global Share |
|---|---|---|---|
| 1 |  China China |
$1.9T | 35.6% |
| 2 |  India India |
$573B | 10.9% |
| 3 |  U.S. U.S. |
$451B | 8.6% |
| 4 |  Brazil Brazil |
$204B | 3.9% |
| 5 |  Indonesia Indonesia |
$145B | 2.8% |
| 6 |  Türkiye Türkiye |
$92B | 1.8% |
| 7 |  Russia Russia |
$87B | 1.7% |
| 8 |  Japan Japan |
$86B | 1.7% |
| 9 |  France France |
$82B | 1.6% |
| 10 |  Mexico Mexico |
$77B | 1.5% |
| 11 |  Pakistan Pakistan |
$75B | 1.4% |
| 12 |  Spain Spain |
$64B | 1.2% |
| 13 |  Germany Germany |
$60B | 1.2% |
| 14 |  Canada Canada |
$58B | 1.1% |
| 15 |  Italy Italy |
$56B | 1.1% |
| 16 |  Vietnam Vietnam |
$56B | 1.1% |
| 17 |  Australia Australia |
$56B | 1.1% |
| 18 |  Colombia Colombia |
$53B | 1.0% |
| 19 |  Thailand Thailand |
$48B | 0.9% |
| 20 |  South Korea South Korea |
$41B | 0.8% |
| 21 |  Egypt Egypt |
$39B | 0.8% |
| 22 |  UK UK |
$35B | 0.7% |
| 23 |  Philippines Philippines |
$35B | 0.7% |
| 24 |  Bangladesh Bangladesh |
$34B | 0.6% |
| 25 |  Poland Poland |
$34B | 0.6% |
| 26 |  Algeria Algeria |
$31B | 0.6% |
| 27 |  Iran Iran |
$31B | 0.6% |
| 28 |  Ukraine Ukraine |
$29B | 0.6% |
| 29 |  Malaysia Malaysia |
$29B | 0.5% |
| 30 |  South Africa South Africa |
$26B | 0.5% |
| 31 |  Netherlands Netherlands |
$22B | 0.4% |
| 32 |  Saudi Arabia Saudi Arabia |
$22B | 0.4% |
| 33 |  Kenya Kenya |
$22B | 0.4% |
| 34 |  Peru Peru |
$22B | 0.4% |
| 35 |  Greece Greece |
$19B | 0.4% |
| 36 |  Côte d’Ivoire Côte d’Ivoire |
$19B | 0.4% |
| 37 |  Uzbekistan Uzbekistan |
$18B | 0.4% |
| 38 |  New Zealand New Zealand |
$17B | 0.3% |
| 39 |  Morocco Morocco |
$17B | 0.3% |
| 40 |  Cambodia Cambodia |
$17B | 0.3% |
| — |  Global Total Global Total |
$5.2T | 100% |
While more than 190 countries produce agricultural goods, China, India, the U.S., and Brazil generate nearly 60% of the world’s agricultural production value.
China and India rely on vast domestic food systems to feed nearly three billion people. The U.S. combines advanced technology with some of the world’s highest crop yields, while Brazil has built its agricultural strength around export competitiveness, making it one of the world’s most efficient agribusiness sectors.
Europe’s Agricultural Heavyweights
Outside Asia and the Americas, agricultural production is spread across several major European economies rather than dominated by a single country.
Russia leads the region, driven by its grain sector. It is the world’s largest wheat exporter and a major supplier of barley and sunflower oil, while France, Germany, Italy, and Spain specialize in higher-value agricultural products such as wine, dairy, and olive oil.
While the world’s largest producers compete on scale, Europe has carved out a niche in higher-value agriculture alongside its leading position in processed food and beverage exports.
The Scale of Global Agriculture
Global agricultural production reached $5.2 trillion in 2024, making it one of the world’s largest industries.
Spanning roughly 50% of the world’s habitable land, agriculture underpins global food supply chains, international trade, and rural economies. As one of the world’s largest employers, its importance extends far beyond the farm gate.
Learn More on the Voronoi App <img style="vertical-align: middle;"
To learn more about this topic, check out this graphic on the number of farms in each state.