Ranked: The World’s Busiest Airlines by Flights
Key Takeaways:
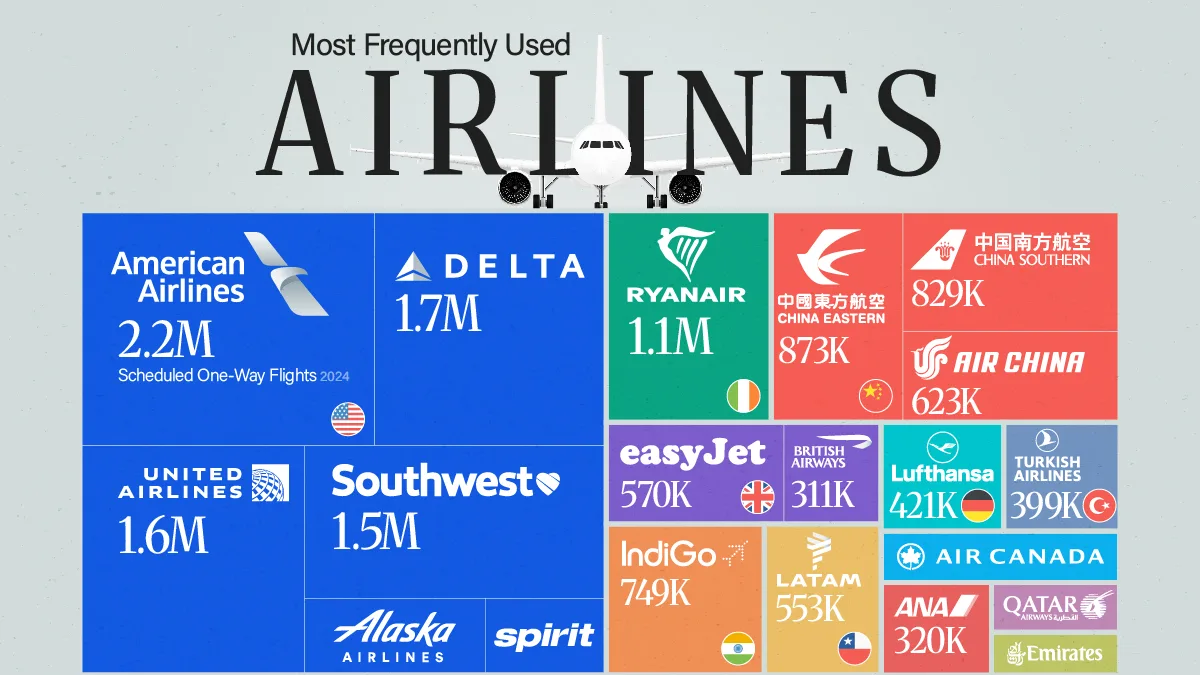
- American Airlines operated 2.18 million scheduled one-way flights in 2024, the most of any airline in the ranking.
- U.S. carriers occupy all four top spots, with American, Delta, United, and Southwest collectively operating nearly 7.0 million flights.
- Ryanair is the highest-ranked non-U.S. carrier, while four Asian airlines place in the global top nine.
This graphic ranks the world’s major airlines by scheduled one-way flight frequency in 2024, based on the OAG Takeoff Airlines Ranking Report 2025. Flight frequency measures scheduled flights rather than passenger traffic, seat capacity, or revenue.
U.S. Airlines Dominate Flight Frequency
The table below shows scheduled one-way flights for the 20 major airlines covered by OAG.
| Rank | Airline Name | Country of Origin | 2024 Scheduled One-Way Flights |
|---|---|---|---|
| 1 | American Airlines |  United States United States |
2,177,424 |
| 2 | Delta Air Lines | United States |
1,713,537 |
| 3 | United Airlines | United States |
1,618,842 |
| 4 | Southwest Airlines | United States |
1,452,219 |
| 5 | Ryanair |  Ireland Ireland |
1,098,831 |
| 6 | China Eastern Airlines |  China China |
872,723 |
| 7 | China Southern Airlines | China |
828,452 |
| 8 | IndiGo |  India India |
749,156 |
| 9 | Air China | China |
622,505 |
| 10 | easyJet |  United Kingdom United Kingdom |
569,588 |
| 11 | LATAM Airlines Group |  Chile Chile |
553,191 |
| 12 | Alaska Airlines | United States |
434,657 |
| 13 | Deutsche Lufthansa AG |  Germany Germany |
421,254 |
| 14 | Turkish Airlines |  Türkiye Türkiye |
398,681 |
| 15 | Air Canada |  Canada Canada |
385,765 |
| 16 | All Nippon Airways |  Japan Japan |
320,042 |
| 17 | British Airways | United Kingdom |
310,518 |
| 18 | Spirit Airlines | United States |
291,178 |
| 19 | Qatar Airways |  Qatar Qatar |
200,385 |
| 20 | Emirates |  United Arab Emirates United Arab Emirates |
172,445 |
The gap between the U.S. leaders and most international carriers is substantial. Fourth-ranked Southwest operated 1.45 million scheduled flights, about 32% more than Ryanair in fifth place. Across the full ranking, the six U.S. carriers listed operated nearly 7.7 million flights.
American’s scale reflects its enormous U.S. network: 82.6% of its 2024 capacity was domestic, according to OAG. Its hub-and-spoke system also concentrates traffic through major connecting airports, including Dallas-Fort Worth, where American held 81% of airline capacity. Large networks are also supported by global partnerships through the world’s three major airline alliances.
Ryanair Leads Europe’s Low-Cost Model
Ireland-based Ryanair ranks fifth globally with 1.10 million flights, almost twice easyJet’s 570,000. Its scale highlights the reach of the low-cost model in Europe.
Budget carriers can keep fares down through high aircraft utilization, rapid turnarounds, point-to-point networks, secondary airports, and unbundled extras. Ryanair’s strategy historically drew inspiration from Southwest Airlines, showing how the low-cost model crossed the Atlantic as European aviation developed around dense networks of relatively short international routes.
Despite the rise of low-cost airlines, most of the world’s busiest carriers by flight frequency are still full-service legacy airlines. The ranking also reflects the broad geographic expansion of commercial aviation since the early jet age, alongside improvements in the industry’s long-term safety record.
Asia Has a Strong Presence in the Top 10
China Eastern ranks sixth with 873,000 flights, followed by China Southern at 828,000 and India’s IndiGo at 749,000. Air China, with 623,000 flights, gives Asia four positions in the global top nine.
OAG data also shows rapid momentum among several Asian carriers. IndiGo’s flight frequency grew 9.7% year over year in 2024, the strongest annual growth among the top 20, while Air China grew 8.1%. The figures highlight the importance of large domestic aviation markets alongside the international networks often associated with major global airlines.
Learn More on the Voronoi App
For another look at the economics of global aviation, see The Top Airline Routes by Revenue, which ranks major routes based on OAG revenue data.