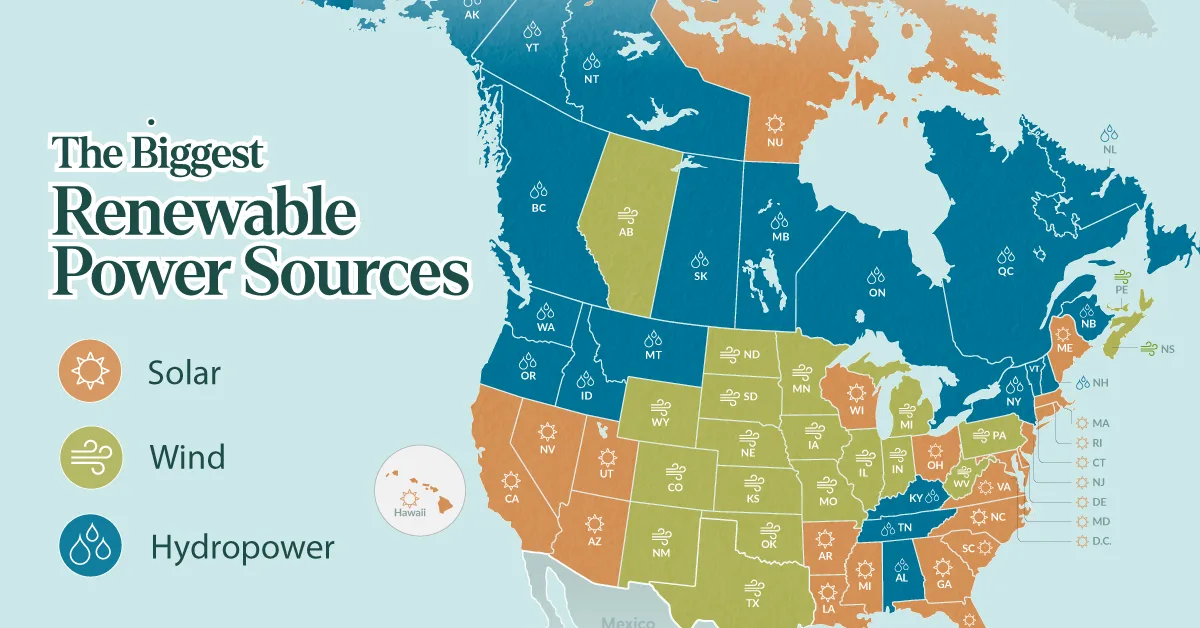
The Top Renewable Power Source by State or Province
Key Takeaways
- Solar is the leading renewable power source in 22 U.S. states, compared with 17 for wind and 11 for hydropower.
- Wind forms a clear regional cluster across the Great Plains, while solar leads in states spanning the West, South, and Northeast.
- Hydropower dominates Canada, ranking first in nine of its 13 provinces and territories.
Which renewable power source comes out on top where you live?
This visualization maps the largest renewable power source in every U.S. state and Canadian province or territory, revealing distinct regional clusters across North America.
The U.S. data for this visualization comes from the U.S. Energy Information Administration, while Canadian data comes from the Canada Energy Regulator.
Wind Power Sweeps Across the Great Plains
Wind forms one of the clearest regional clusters on the map, leading across a broad stretch of the central United States.
Iowa, Kansas, Oklahoma, North Dakota, South Dakota, Nebraska, and Texas all rank wind first. Strong wind resources and large areas of open land have helped support utility-scale development across the Great Plains.
North of the border, wind is also the leading renewable source in Alberta, Nova Scotia, and Prince Edward Island.
| State/Province/Territory | Largest Renewable Source |
|---|---|
 Alabama Alabama |
Hydropower |
| Alaska |
Hydropower |
 Alberta Alberta |
Wind |
| Arizona |
Solar |
| Arkansas |
Solar |
| British Columbia |
Hydropower |
| California |
Solar |
| Colorado |
Wind |
| Connecticut |
Solar |
| Delaware |
Solar |
| Florida |
Solar |
| Georgia |
Solar |
| Hawaii |
Solar |
| Idaho |
Hydropower |
| Illinois |
Wind |
| Indiana |
Wind |
| Iowa |
Wind |
| Kansas |
Wind |
| Kentucky |
Hydropower |
| Louisiana |
Solar |
| Maine |
Solar |
| Manitoba |
Hydropower |
| Maryland |
Solar |
| Massachusetts |
Solar |
| Michigan |
Wind |
| Minnesota |
Wind |
| Mississippi |
Solar |
| Missouri |
Wind |
| Montana |
Hydropower |
| Nebraska |
Wind |
| Nevada |
Solar |
| New Brunswick |
Hydropower |
| New Hampshire |
Hydropower |
| New Jersey |
Solar |
| New Mexico |
Wind |
| New York |
Hydropower |
| Newfoundland and Labrador |
Hydropower |
| North Carolina |
Solar |
| North Dakota |
Wind |
| Northwest Territories |
Hydropower |
| Nova Scotia |
Wind |
| Nunavut |
Solar |
| Ohio |
Solar |
| Oklahoma |
Wind |
| Ontario |
Hydropower |
| Oregon |
Hydropower |
| Pennsylvania |
Wind |
| Prince Edward Island |
Wind |
| Quebec |
Hydropower |
| Rhode Island |
Solar |
| Saskatchewan |
Hydropower |
| South Carolina |
Solar |
| South Dakota |
Wind |
| Tennessee |
Hydropower |
| Texas |
Wind |
| Utah |
Solar |
| Vermont |
Hydropower |
| Virginia |
Solar |
| Washington |
Hydropower |
| West Virginia |
Wind |
| Wisconsin |
Solar |
| Wyoming |
Wind |
| Yukon |
Hydropower |
In 2025, wind generated more electricity than either solar or hydropower in the United States.
Solar Leads Across the South and Beyond
Solar has the broadest reach across the U.S. map, leading from California and Nevada in the West to Florida, Georgia, and the Carolinas in the Southeast.
It also ranks first in several Northeastern states, including Massachusetts, New Jersey, Connecticut, and Rhode Island.
Across all 63 jurisdictions, solar leads in 23, while wind and hydropower each lead in 20. However, the regional breakdown reveals a clear divide, with solar leading most often in the U.S. and hydropower dominating Canada.
| Top Renewable Power Source | U.S. (States) |
Canada (Provinces/Territories) |
Total |
|---|---|---|---|
| Solar | 22 | 1 | 23 |
| Wind | 17 | 3 | 20 |
| Hydropower | 11 | 9 | 20 |
Hydropower Leads in the Pacific Northwest
Hydropower is the largest renewable source in Washington, Oregon, Idaho, and Alaska, giving it a strong presence across the northwestern U.S.
The pattern becomes even more pronounced north of the border. Hydropower ranks first in nine of Canada’s 13 provinces and territories, including Quebec, British Columbia, Manitoba, and Newfoundland and Labrador.
Canada’s extensive river systems and large elevation changes have supported major hydroelectric projects for decades.
Nunavut stands apart as the only Canadian jurisdiction in the dataset where solar is the largest renewable source.
Learn More on the Voronoi App 
If you enjoyed today’s post, check out this graphic showing how the world now spends $1.83 on clean energy for every $1 invested in fossil fuels.
- Source: https://www.visualcapitalist.com/mapped-the-top-renewable-power-source-by-state-or-province/