Where Gas Is Most Expensive in America
Key Takeaways
- The average price of gas in the U.S. is $4.48 per gallon as of September 2026, up more than a dollar from the previous year.
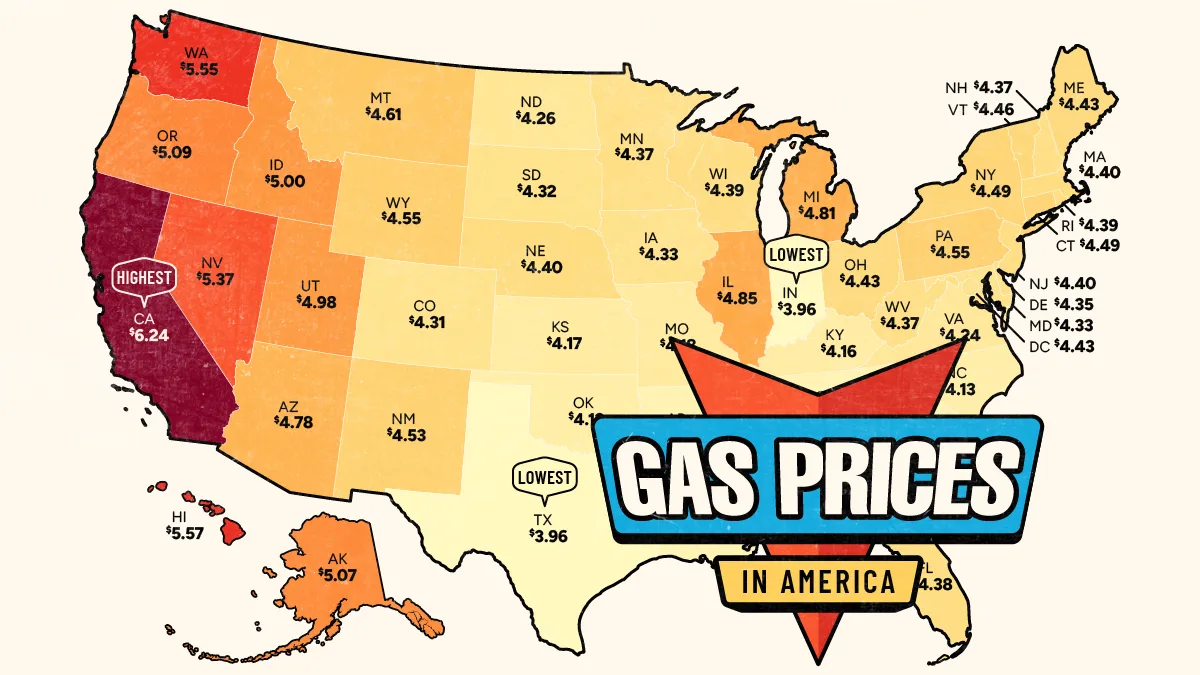
- California has the highest average gas price in the country at $6.24 per gallon, while Texas and Indiana tie for the lowest at $3.96.
- Filling a 15-gallon tank costs about $34 more in California than in the two cheapest states.
Where you fill up can make a significant difference in what you pay at the pump.
This map shows average regular gasoline prices across the U.S. using September 2026 data from AAA Fuel Tracker. Prices are per gallon and rounded to the nearest cent.
Where Gas Prices Run Highest and Lowest
The broader divide is regional. The highest fuel prices are concentrated in the West, while much of the South sits below the $4.48 national average.
The table below ranks prices from highest to lowest in the 50 states and Washington, D.C.
| Rank | State or District | Average Gas Price in September 2026 ($) |
|---|---|---|
| 1 | California | 6.24 |
| 2 | Hawaii | 5.57 |
| 3 | Washington | 5.55 |
| 4 | Nevada | 5.37 |
| 5 | Oregon | 5.09 |
| 6 | Alaska | 5.07 |
| 7 | Idaho | 5.00 |
| 8 | Utah | 4.98 |
| 9 | Illinois | 4.85 |
| 10 | Michigan | 4.81 |
| 11 | Arizona | 4.78 |
| 12 | Montana | 4.61 |
| 13 | Pennsylvania | 4.55 |
| 13 | Wyoming | 4.55 |
| 15 | New Mexico | 4.53 |
| 16 | Connecticut | 4.49 |
| 16 | New York | 4.49 |
| 18 | Vermont | 4.46 |
| 19 | District of Columbia | 4.43 |
| 19 | Maine | 4.43 |
| 19 | Ohio | 4.43 |
| 22 | Massachusetts | 4.40 |
| 22 | Nebraska | 4.40 |
| 22 | New Jersey | 4.40 |
| 25 | Rhode Island | 4.39 |
| 25 | Wisconsin | 4.39 |
| 27 | Florida | 4.38 |
| 28 | Minnesota | 4.37 |
| 28 | New Hampshire | 4.37 |
| 28 | West Virginia | 4.37 |
| 31 | Delaware | 4.35 |
| 32 | Iowa | 4.33 |
| 32 | Maryland | 4.33 |
| 34 | South Dakota | 4.32 |
| 35 | Colorado | 4.31 |
| 36 | North Dakota | 4.26 |
| 37 | Virginia | 4.24 |
| 38 | Missouri | 4.18 |
| 39 | Kansas | 4.17 |
| 40 | Kentucky | 4.16 |
| 41 | North Carolina | 4.13 |
| 42 | Oklahoma | 4.12 |
| 43 | Georgia | 4.11 |
| 44 | Alabama | 4.09 |
| 45 | Arkansas | 4.06 |
| 45 | Tennessee | 4.06 |
| 47 | South Carolina | 4.05 |
| 48 | Louisiana | 4.03 |
| 49 | Mississippi | 4.00 |
| 50 | Indiana | 3.96 |
| 50 | Texas | 3.96 |
| — |  U.S. National Average U.S. National Average |
4.48 |
Part of the difference reflects the journey fuel takes to reach a station. Longer distances from refineries, ports, and distribution terminals can mean higher transportation costs, which can push up retail prices.
States such as Louisiana and Texas also benefit from extensive oil and refining infrastructure, helping keep distribution costs relatively low.
Why California Costs So Much More
California’s premium goes beyond taxes. The Golden State requires a special gasoline blend designed to reduce air pollution, which costs more to produce. State environmental programs also add compliance costs for fuel suppliers, alongside state and local taxes.
The state’s specialized fuel comes from a relatively limited pool of suppliers. California is geographically separated from major U.S. refining centers along the Gulf Coast, and only some refineries elsewhere can produce gasoline that meets its requirements. Bringing in additional supply is therefore more complicated than simply sourcing cheaper fuel from another state.
This becomes especially important when a refinery shuts down for maintenance or experiences an unexpected outage. Replacement supplies can take time to arrive, leaving the market more vulnerable to price spikes. The same factors that keep California expensive under normal conditions can make disruptions more painful for drivers.
No Relief This Fall
Gas prices usually ease after the summer driving season. Demand falls as travel slows, while cooler weather allows refiners to use less expensive gasoline components that would evaporate too easily in summer heat. The seasonal change in fuel requirements can help reduce costs even without a decline in global oil prices.
This September, however, that usual pattern has been disrupted. Expensive crude oil and continued volatility in the Strait of Hormuz have pushed up prices at the pump. The national average of $4.48 per gallon is the highest on record for late September.
Local advantages offer only partial protection from those pressures. Gasoline prices generally track crude oil costs, so even states with lower distribution costs and taxes remain exposed to oil-market disruptions.
Learn More on the Voronoi App
To compare these prices with major global events, check out Oil Prices and Geopolitical Events on Voronoi.