Mapped: America’s Hiring Map Has Flipped Since 2020
See visuals like this from many other data creators on our Voronoi app. Download it for free on iOS or Android and discover incredible data-driven charts from a variety of trusted sources.
Key Takeaways
- Idaho has seen America’s biggest hiring surge since 2020, with job openings up nearly 21%.
- Wyoming ranks last, with openings down 39% from pre-pandemic levels.
- America’s hiring recovery has become increasingly uneven, with sharp divides emerging between neighboring states and regions.
America’s hiring recovery has split into sharply different regional stories since 2020.
Some states, including Idaho, Mississippi, Oklahoma, and Texas, continue seeing elevated hiring demand years after the pandemic. Others, particularly across parts of the West Coast and Mountain West, have experienced steep declines in job openings.
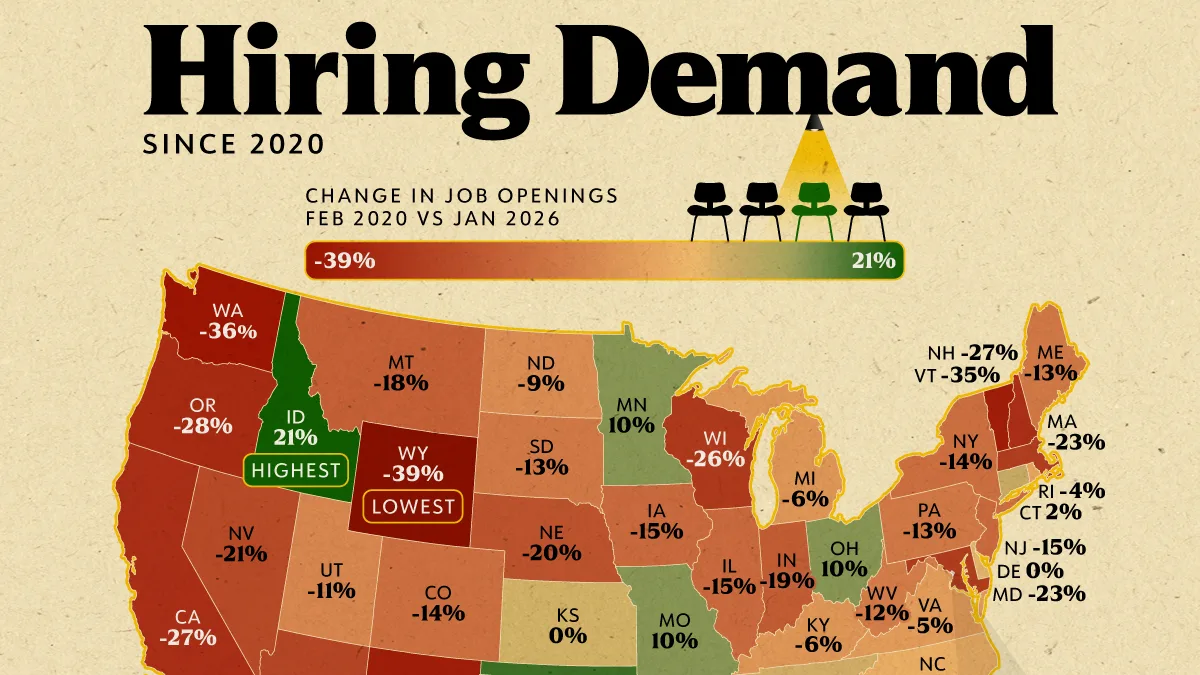
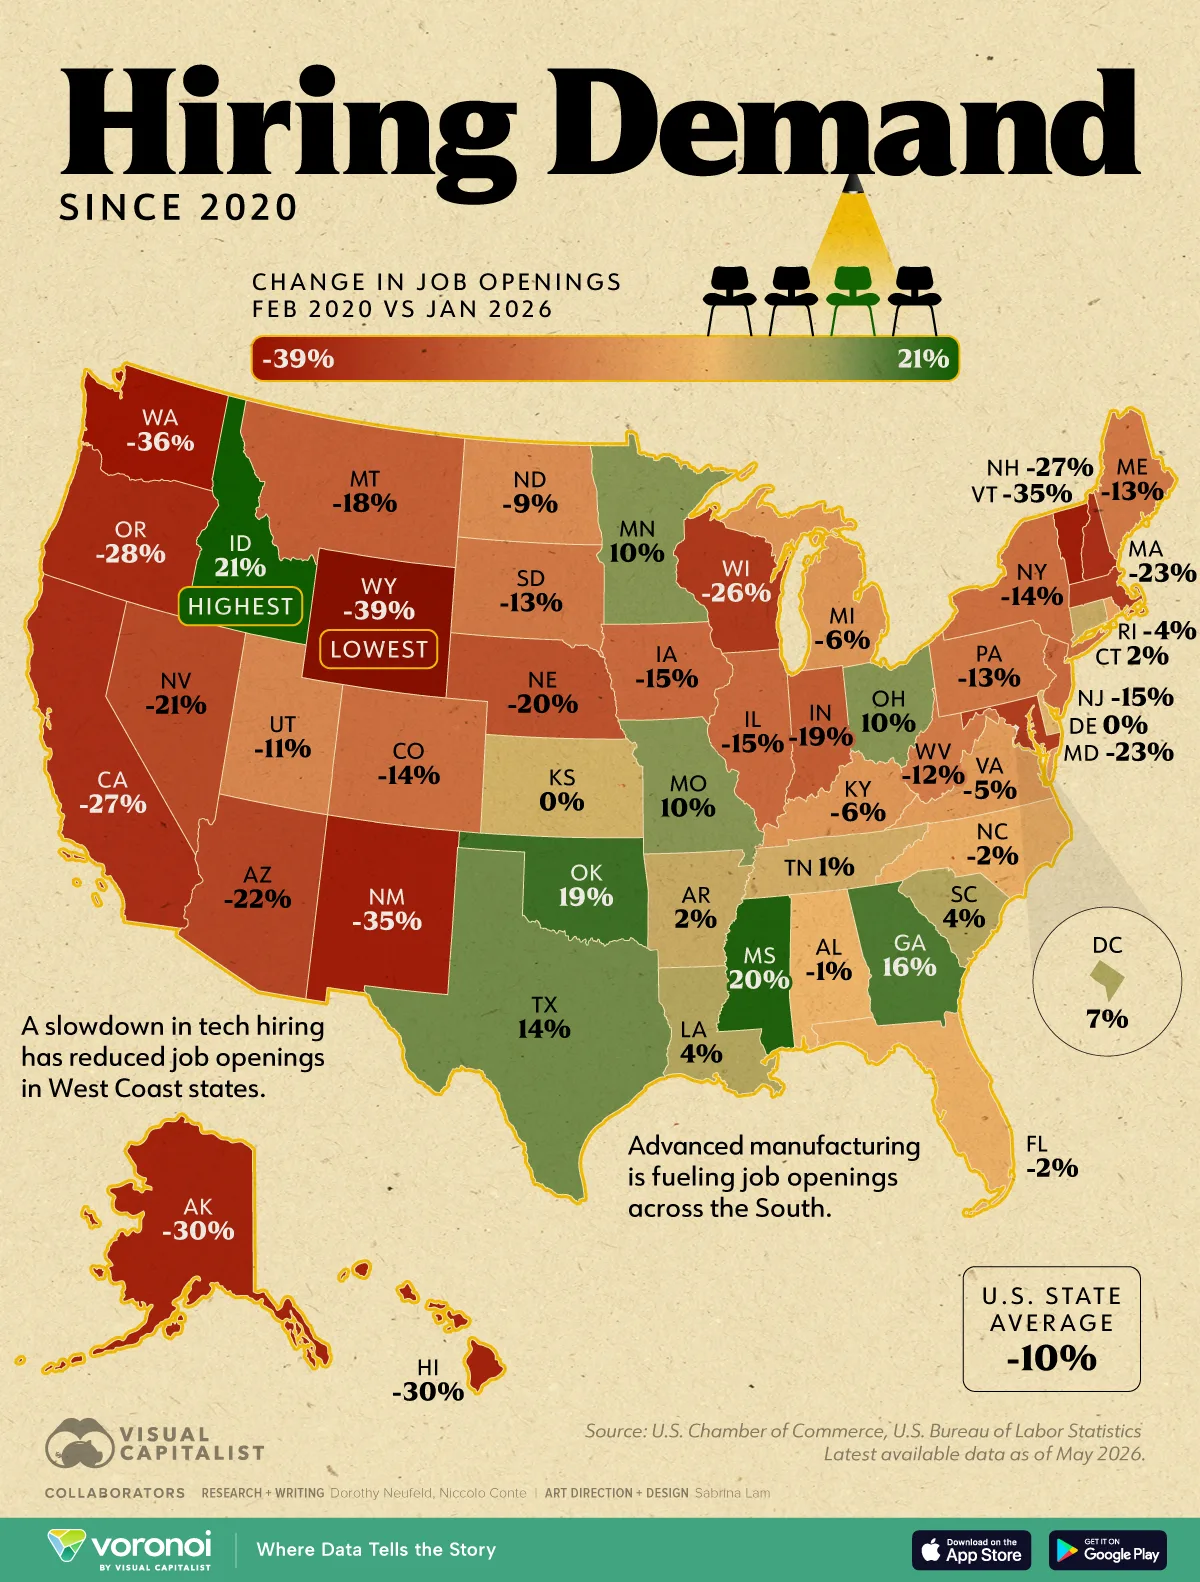
The map below shows how job openings changed in every state between February 2020 and January 2026, based on data from the U.S. Chamber of Commerce.
The contrast is especially striking in the Mountain West. Idaho leads the nation with hiring demand up over 20%, while neighboring Wyoming ranks last at -39%.
Where Job Openings Have Increased the Most
The rankings below show the change in job openings since 2020 by state.
| Rank | State | Change in Job Openings Feb 2020 vs Jan 2026 |
|---|---|---|
| 1 | Idaho | 20.5% |
| 2 | Mississippi | 19.6% |
| 3 | Oklahoma | 18.8% |
| 4 | Georgia | 16.0% |
| 5 | Texas | 14.2% |
| 6 | Ohio | 9.9% |
| 7 | Missouri | 9.7% |
| 8 | Minnesota | 9.5% |
| 9 | District of Columbia | 6.5% |
| 10 | Louisiana | 4.4% |
| 11 | South Carolina | 3.7% |
| 12 | Arkansas | 1.6% |
| 13 | Connecticut | 1.5% |
| 14 | Tennessee | 0.7% |
| 15 | Delaware | 0.0% |
| 16 | Kansas | 0.0% |
| 17 | Alabama | -1.0% |
| 18 | North Carolina | -1.7% |
| 19 | Florida | -1.8% |
| 20 | Rhode Island | -4.2% |
| 21 | Virginia | -4.5% |
| 22 | Michigan | -5.5% |
| 23 | Kentucky | -6.4% |
| 24 | North Dakota | -8.7% |
| 25 | Utah | -10.7% |
| 26 | West Virginia | -12.0% |
| 27 | Maine | -12.5% |
| 28 | South Dakota | -13.0% |
| 29 | Pennsylvania | -13.2% |
| 30 | New York | -13.5% |
| 31 | Colorado | -14.1% |
| 32 | Iowa | -14.5% |
| 33 | New Jersey | -14.8% |
| 34 | Illinois | -15.4% |
| 35 | Montana | -17.9% |
| 36 | Indiana | -19.2% |
| 37 | Nebraska | -20.0% |
| 38 | Nevada | -20.5% |
| 39 | Arizona | -22.3% |
| 40 | Maryland | -22.7% |
| 41 | Massachusetts | -22.8% |
| 42 | Wisconsin | -25.6% |
| 43 | New Hampshire | -26.5% |
| 44 | California | -27.0% |
| 45 | Oregon | -28.4% |
| 46 | Hawaii | -30.0% |
| 47 | Alaska | -30.4% |
| 48 | New Mexico | -35.3% |
| 49 | Vermont | -35.3% |
| 50 | Washington | -36.3% |
| 51 | Wyoming | -38.9% |
| — |  U.S. State Average U.S. State Average |
-9.6% |
Where Hiring Demand Is Growing Fastest
Idaho leads the nation with job openings up 20.5% since 2020, followed by Mississippi and Oklahoma. Georgia (16.0%) and Texas (14.2%) have also posted strong gains, reflecting continued migration toward lower-cost states and expanding regional economies.
Manufacturing investment is helping drive demand. Billions of dollars tied to semiconductors, EVs, and industrial reshoring have fueled hiring across parts of the South and Midwest. Significant population growth has added another tailwind, boosting both labor supply and consumer demand.
The map highlights how America’s labor market is increasingly diverging at the state level, with neighboring states often moving in very different directions.
Why Many Western States Saw Hiring Cool Off
Several Western states have seen some of America’s steepest declines in job openings since 2020.
Wyoming ranks last nationally, with hiring demand down 38.9%, while Washington is close behind at -36.3%. California, Oregon, and Nevada have also posted sizable declines after the rapid hiring surge seen earlier in the decade.
Much of the slowdown reflects a reversal of pandemic-era expansion, especially across technology and white-collar industries. During 2021 and 2022, many companies aggressively expanded payrolls amid booming demand and cheap capital. Since then, layoffs, higher interest rates, and efficiency-focused cost-cutting have pushed many firms into retrenchment mode.
California alone has announced more layoffs than any other state since 2022. The result is a labor market that looks very different from the hiring frenzy that defined the post-pandemic recovery.
What It Means for Workers and the Economy
Hiring demand affects more than just how easy it is to find a job. It can influence migration patterns, wage growth, housing demand, and local economic confidence.
States with stronger hiring markets often attract more workers, investment, and new business formation, reinforcing long-term economic growth. Weaker hiring markets, meanwhile, may experience softer consumer spending and slower labor demand.
The map increasingly reflects broader economic shifts unfolding across America. Lower-cost states continue attracting people, capital, and industrial investment, while many high-cost markets are adjusting to slower growth after the pandemic-era boom.
The result is a labor market that is becoming more fragmented geographically, with economic momentum increasingly concentrated in a smaller group of states.
Learn More on the Voronoi App 
To learn more about this topic, check out this graphic showing where wealth is moving across America.