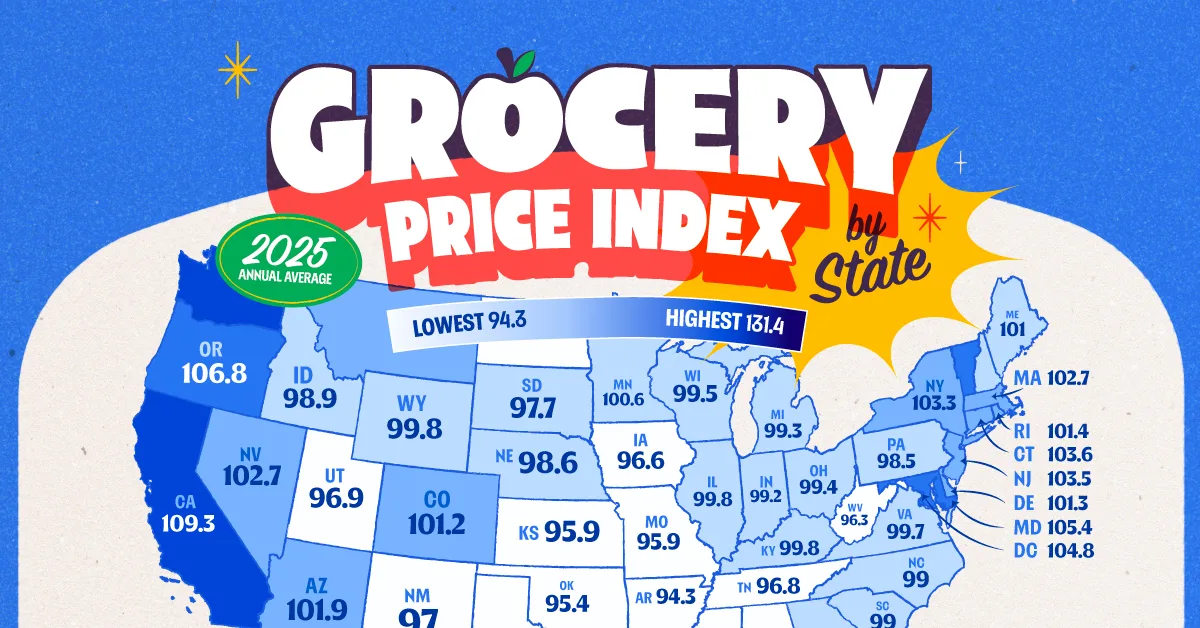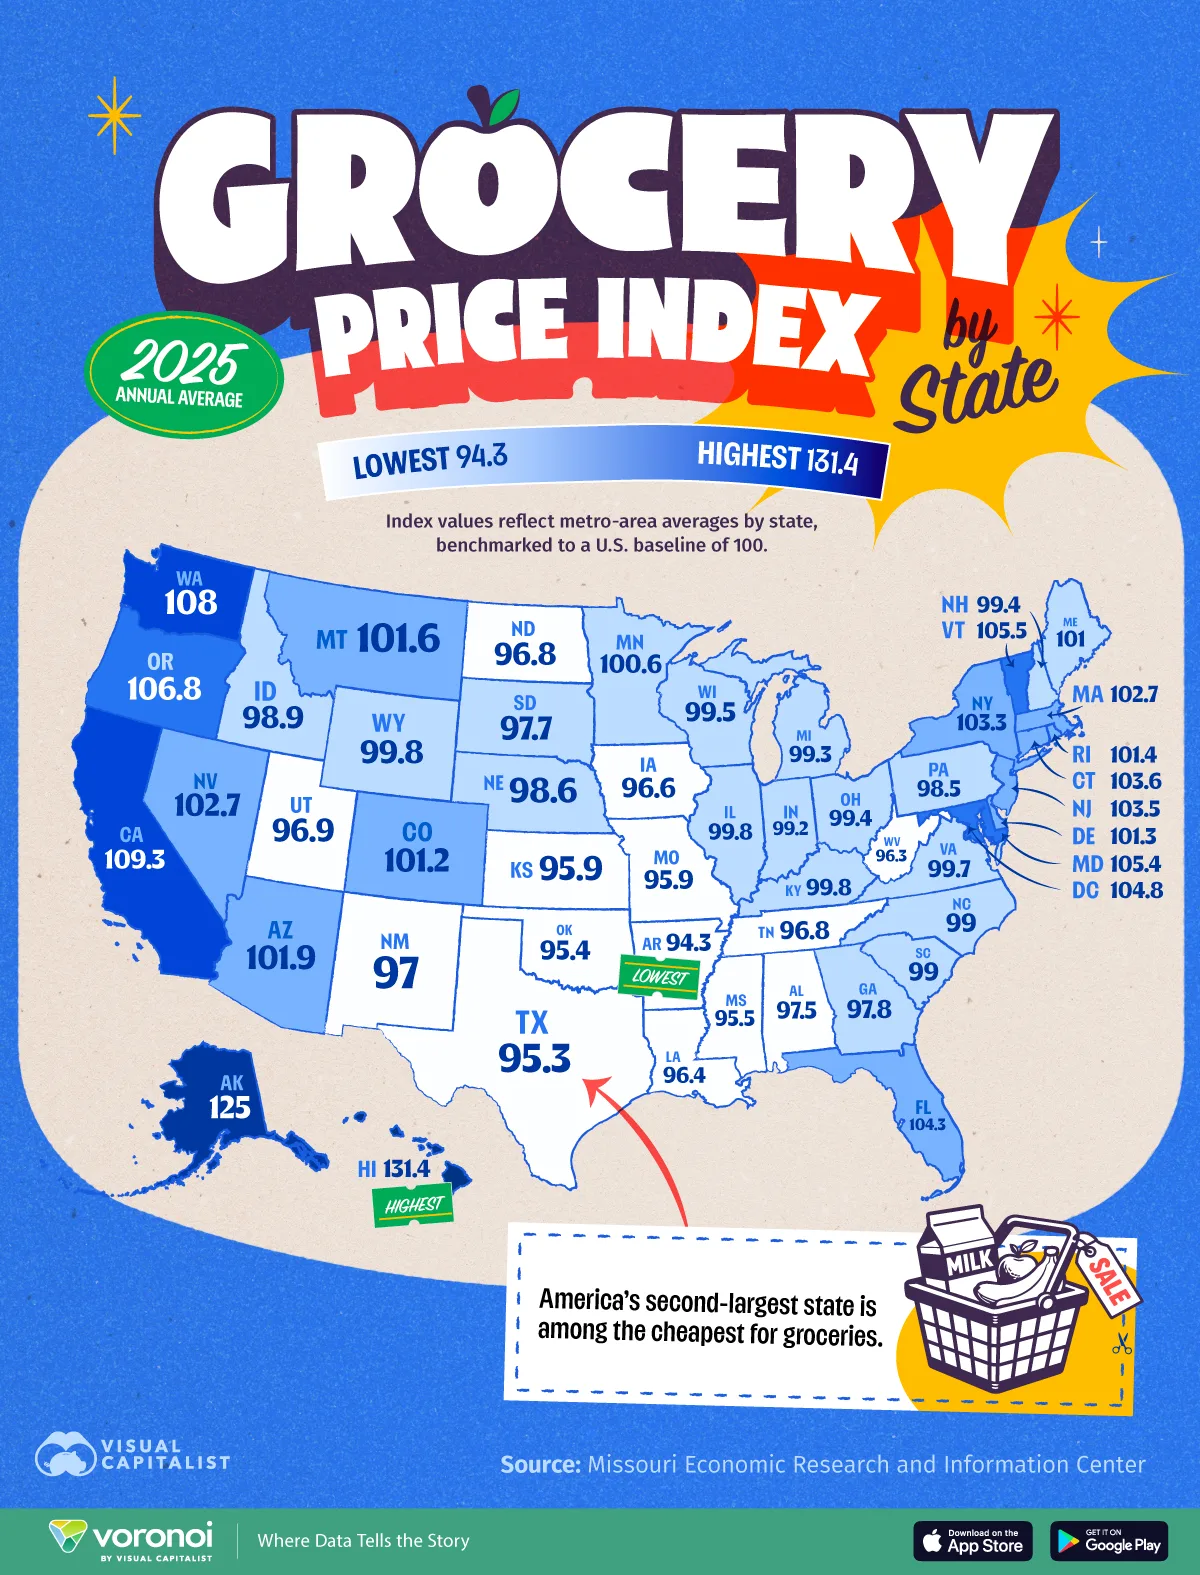
Mapped: Grocery Prices Across U.S. States
See visuals like this from many other data creators on our Voronoi app. Download it for free on iOS or Android and discover incredible data-driven charts from a variety of trusted sources.
Key Takeaways
- Grocery prices vary by nearly 40% across U.S. states based on 2025 averages.
- Hawaii and Alaska have the highest costs, both over 25% above average.
- Southern states dominate the lowest-cost rankings, led by Arkansas.
Hawaii and Alaska have the highest grocery costs in the U.S., with prices more than 25% above the national average.
Using data from the Missouri Economic Research and Information Center, this map ranks grocery prices across all 50 states relative to a U.S. baseline of 100.
While Hawaii and Alaska are far above average due to shipping costs and geographic isolation, many Southern states offer the lowest prices, highlighting how regional cost structures shape what Americans pay at the checkout.
This variation comes at a time when food prices remain a top concern for consumers, with grocery costs still elevated compared to pre-pandemic levels.
Ranked: States With the Highest Grocery Prices
Hawaii and Alaska stand apart, with grocery prices 31.4% and 25% above the national average.
Their geographic isolation means both states rely heavily on imported goods, making transportation a key driver of higher costs. For a typical household spending $8,000–$10,000 per year on groceries, this price gap can translate into an extra $2,000 or more annually in the most expensive states.
The table below shows each state’s grocery price index, based on 2025 annual averages benchmarked to a U.S. baseline of 100:
| Rank | State or District | Grocery Price Index 2025 | Cost of Living Index 2025 |
|---|---|---|---|
| 1 | Hawaii | 131.4 | 183.9 |
| 2 | Alaska | 125.0 | 126.7 |
| 3 | California | 109.3 | 143.1 |
| 4 | Washington | 108.0 | 112.9 |
| 5 | Oregon | 106.8 | 112.8 |
| 6 | Vermont | 105.5 | 113.5 |
| 7 | Maryland | 105.4 | 117.4 |
| 8 | District of Columbia | 104.8 | 137.8 |
| 9 | Florida | 104.3 | 101.4 |
| 10 | Connecticut | 103.6 | 114.0 |
| 11 | New Jersey | 103.5 | 115.3 |
| 12 | New York | 103.3 | 125.8 |
| 13 | Nevada | 102.7 | 99.7 |
| 14 | Massachusetts | 102.7 | 148.5 |
| 15 | Arizona | 101.9 | 110.3 |
| 16 | Montana | 101.6 | 96.8 |
| 17 | Rhode Island | 101.4 | 110.7 |
| 18 | Delaware | 101.3 | 103.1 |
| 19 | Colorado | 101.2 | 103.1 |
| 20 | Maine | 101.0 | 114 |
| 21 | Minnesota | 100.6 | 93.6 |
| 22 | Kentucky | 99.8 | 91.5 |
| 23 | Wyoming | 99.8 | 94.6 |
| 24 | Illinois | 99.8 | 95.0 |
| 25 | Virginia | 99.7 | 102.2 |
| 26 | Wisconsin | 99.5 | 98.5 |
| 27 | Ohio | 99.4 | 94.6 |
| 28 | New Hampshire | 99.4 | 110.5 |
| 29 | Michigan | 99.3 | 91.9 |
| 30 | Indiana | 99.2 | 90.7 |
| 31 | South Carolina | 99.0 | 92.7 |
| 32 | North Carolina | 99.0 | 97.9 |
| 33 | Idaho | 98.9 | 99.3 |
| 34 | Nebraska | 98.6 | 91.8 |
| 35 | Pennsylvania | 98.5 | 97.1 |
| 36 | Georgia | 97.8 | 92.2 |
| 37 | South Dakota | 97.7 | 91.8 |
| 38 | Alabama | 97.5 | 88.1 |
| 39 | New Mexico | 97.0 | 93.7 |
| 40 | Utah | 96.9 | 99.5 |
| 41 | Tennessee | 96.8 | 90.1 |
| 42 | North Dakota | 96.8 | 91.1 |
| 43 | Iowa | 96.6 | 89.8 |
| 44 | Louisiana | 96.4 | 92.9 |
| 45 | West Virginia | 96.3 | 88 |
| 46 | Kansas | 95.9 | 88.4 |
| 47 | Missouri | 95.9 | 88.9 |
| 48 | Mississippi | 95.5 | 86.0 |
| 49 | Oklahoma | 95.4 | 84.7 |
| 50 | Texas | 95.3 | 91.1 |
| 51 | Arkansas | 94.3 | 90.1 |
California’s grocery prices are 9.3% above the U.S. average, ranking third among all states.
Despite its massive agricultural output, California’s grocery prices remain elevated due to high labor, energy, and real estate costs. Washington faces similar pressures, along with some of the highest fuel costs in the country.
A cluster of Northeastern states—Vermont, Maryland, and Washington, D.C.—also rank among the most expensive, with grocery prices 5–6% above average. Vermont’s low population density increases transportation costs, while Washington, D.C.’s high commercial rents and wages push prices higher.
Florida ranks ninth for grocery costs, despite a more moderate cost of living. A relatively concentrated grocery market gives dominant players greater pricing power, while its tourism industry keeps demand elevated, both contributing to above-average food prices.
The Least Expensive Grocery Prices in America
Arkansas has the lowest grocery prices in the U.S., at 5.7% below the national average—marking a sharp contrast with the country’s most expensive states.
It is followed by Southern states like Texas, Oklahoma, and Mississippi, where grocery prices are often 5–10% below the national average, well below many coastal and non-contiguous states.
These states also have a lower overall cost of living, meaning housing, fuel, and groceries take up a smaller share of household budgets overall.
Learn More on the Voronoi App 
To learn more about this topic, check out this graphic on the average weekly grocery bill by state.