Mapped: The Top 50 Economies in the World by GDP
See visuals like this from many other data creators on our Voronoi app. Download it for free on iOS or Android and discover incredible data-driven charts from a variety of trusted sources.
Key Takeaways
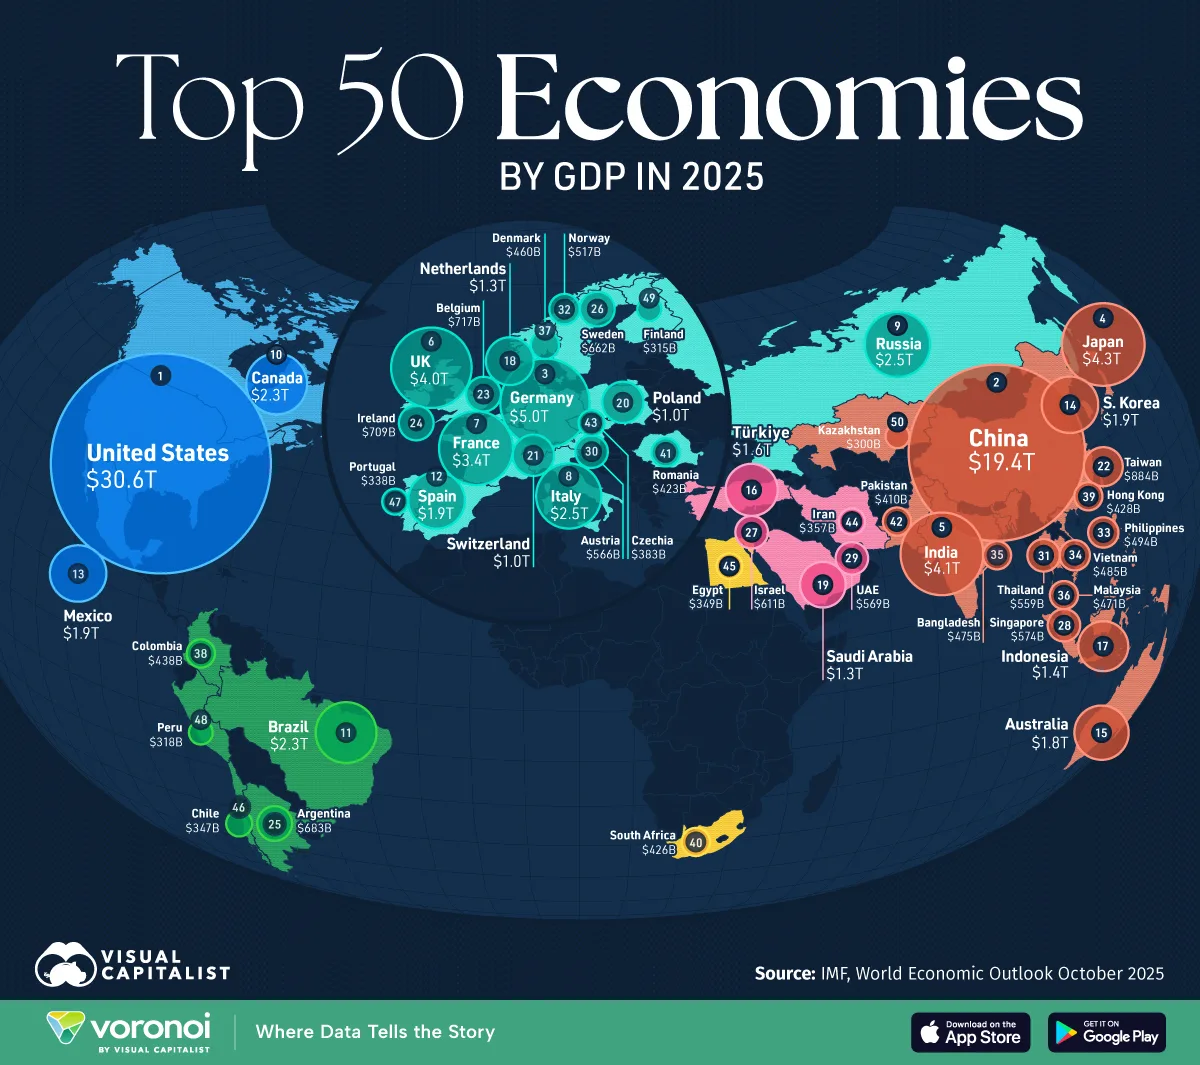
- America’s economic output stands at $30.6 trillion in 2025, while China’s totaled $19.4 trillion.
- Europe is home to five of the world’s top 10 economies by GDP, while Asia houses three.
As power politics moves away from a unipolar world to a multipolar one, the U.S. and China hold distinct spheres of influence.
Since the turn of the century, China’s economy has grown 586%, comfortably sitting as the world’s largest trading partner. Meanwhile, America’s protectionist trade policies are reshaping long-standing alliances.
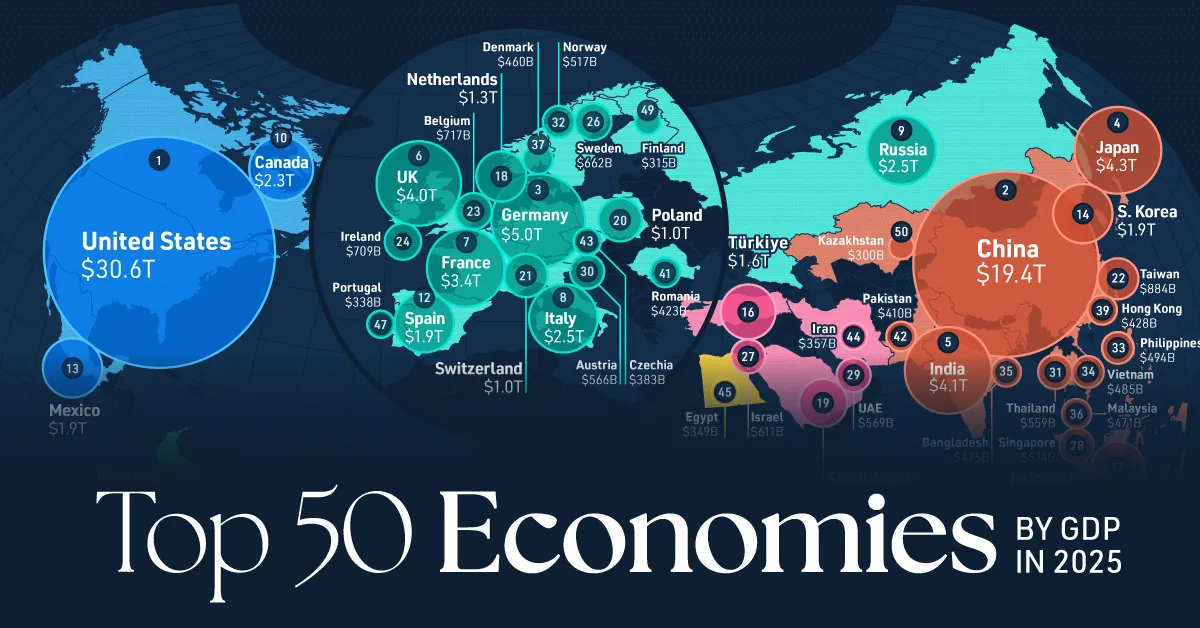
This graphic shows the top 50 economies in the world, based on data from the IMF’s latest World Economic Outlook.
Ranked: The Top 50 Economies in the World
Below, we show the biggest economies worldwide:
| Rank | Country | GDP 2025 (B) | 2025 Annual Real GDP Growth |
|---|---|---|---|
| 1 |  United States United States |
$30,616 | 2.0% |
| 2 |  China China |
$19,399 | 4.8% |
| 3 |  Germany Germany |
$5,014 | 0.2% |
| 4 |  Japan Japan |
$4,280 | 1.1% |
| 5 |  India India |
$4,125 | 6.6% |
| 6 |  United Kingdom United Kingdom |
$3,959 | 1.3% |
| 7 |  France France |
$3,362 | 0.7% |
| 8 |  Italy Italy |
$2,544 | 0.5% |
| 9 |  Russia Russia |
$2,541 | 0.6% |
| 10 |  Canada Canada |
$2,284 | 1.2% |
| 11 |  Brazil Brazil |
$2,257 | 2.4% |
| 12 |  Spain Spain |
$1,891 | 2.9% |
| 13 |  Mexico Mexico |
$1,863 | 1.0% |
| 14 |  South Korea South Korea |
$1,859 | 0.9% |
| 15 |  Australia Australia |
$1,830 | 1.8% |
| 16 |  Türkiye Türkiye |
$1,565 | 3.5% |
| 17 |  Indonesia Indonesia |
$1,443 | 4.9% |
| 18 |  Netherlands Netherlands |
$1,321 | 1.4% |
| 19 |  Saudi Arabia Saudi Arabia |
$1,269 | 4.0% |
| 20 |  Poland Poland |
$1,040 | 3.2% |
| 21 |  Switzerland Switzerland |
$1,003 | 0.9% |
| 22 |  Taiwan Taiwan |
$884 | 3.7% |
| 23 |  Belgium Belgium |
$717 | 1.1% |
| 24 |  Ireland Ireland |
$709 | 9.1% |
| 25 |  Argentina Argentina |
$683 | 4.5% |
| 26 |  Sweden Sweden |
$662 | 0.7% |
| 27 |  Israel Israel |
$611 | 2.5% |
| 28 |  Singapore Singapore |
$574 | 2.2% |
| 29 |  UAE UAE |
$569 | 4.8% |
| 30 |  Austria Austria |
$566 | 0.3% |
| 31 |  Thailand Thailand |
$559 | 2.0% |
| 32 |  Norway Norway |
$517 | 1.2% |
| 33 |  Philippines Philippines |
$494 | 5.4% |
| 34 |  Vietnam Vietnam |
$485 | 6.5% |
| 35 |  Bangladesh Bangladesh |
$475 | 3.8% |
| 36 |  Malaysia Malaysia |
$471 | 4.5% |
| 37 |  Denmark Denmark |
$460 | 1.8% |
| 38 |  Colombia Colombia |
$438 | 2.5% |
| 39 |  Hong Kong SAR Hong Kong SAR |
$428 | 2.4% |
| 40 |  South Africa South Africa |
$426 | 1.1% |
| 41 |  Romania Romania |
$423 | 1.0% |
| 42 |  Pakistan Pakistan |
$410 | 2.7% |
| 43 |  Czech Republic Czech Republic |
$383 | 2.3% |
| 44 |  Iran Iran |
$357 | 0.6% |
| 45 |  Egypt Egypt |
$349 | 4.3% |
| 46 |  Chile Chile |
$347 | 2.5% |
| 47 |  Portugal Portugal |
$338 | 1.9% |
| 48 |  Peru Peru |
$318 | 2.9% |
| 49 |  Finland Finland |
$315 | 0.5% |
| 50 |  Kazakhstan Kazakhstan |
$300 | 5.9% |
In 2025, U.S. real GDP is projected to rise 2%, falling just under its 25-year average.
Recent trade policy changes under the Trump administration have not yet had a significant measurable impact on overall economic performance. However, some effects, such as higher business costs or shifts in investment, may become more evident in 2026. Consumer spending and investment related to artificial intelligence remain notable contributors to economic activity.
China is forecast to grow by 4.8% in 2025, reaching an estimated GDP of $19.4 trillion. Despite higher U.S. tariffs, China continues to play a central role in global supply chains, particularly in the production and refining of critical mineral.
While Germany stands as the largest economy in Europe, and the third-largest globally, its economy has lagged for years. Weaker exports and low GDP growth paint a dismal picture for the country, even with over $500 billion in infrastructure spending.
India ranks fifth globally, at $4.1 trillion. Since 2000, its economy has expanded by more than threefold.
Finally, Africa has two economies in the top 50, South Africa (#40) and Egypt (#45). Both operate as major trade hubs at each end of Africa, thanks to the Suez Canal and South Africa’s deep capital markets and regional supply chains.
Learn More on the Voronoi App 
To learn more about this topic, check out this graphic on global growth forecasts for 2025.