Ranked: Real Estate Returns Across 57 Countries Since 2008
Key Takeaways:
- Since 2008, Israel recorded the highest inflation-adjusted housing return in U.S. dollar terms at 101%, followed by Hong Kong at 81%.
- Of the 57 markets analyzed, 28 posted positive real returns, while 29 lost value after adjusting for U.S. inflation.
- The U.S. ranked seventh, with housing prices rising 49% after adjusting for U.S. inflation.
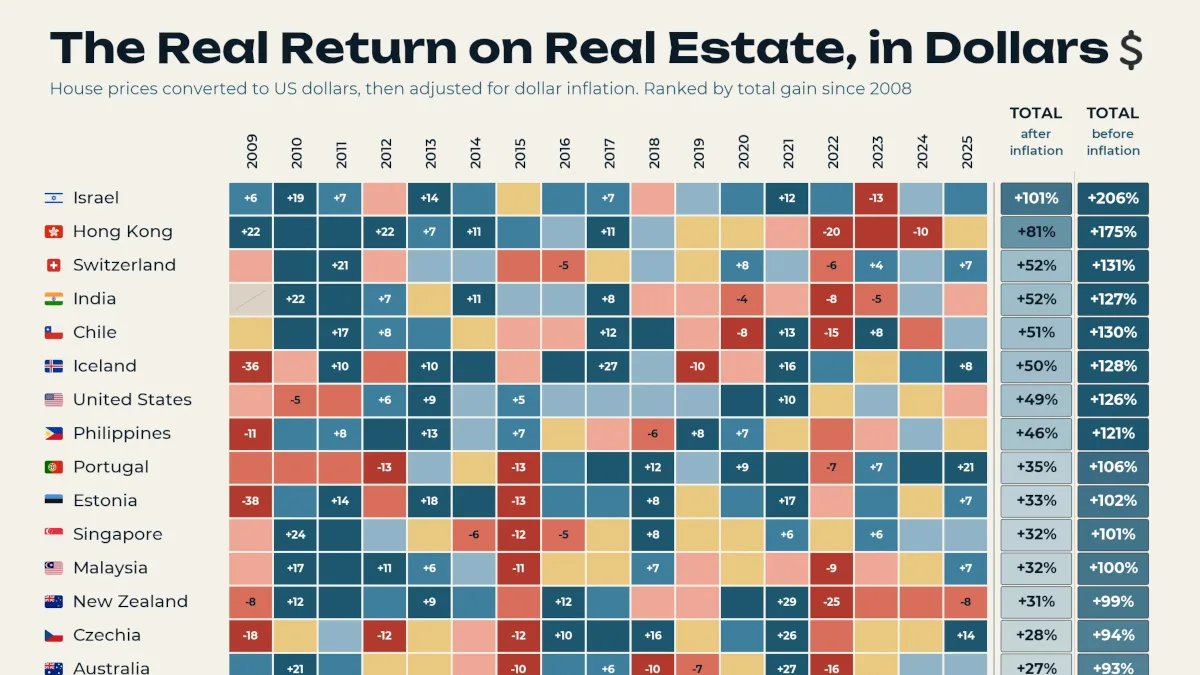
Real estate is often described as an inflation hedge, but that protection varies considerably by market. This visualization by Valerii Emelianov tracks residential property prices since 2008 after converting them into U.S. dollars and adjusting for U.S. inflation.
The analysis uses the BIS Residential Property Price Database, with World Bank official exchange rates. The figures measure changes in residential property prices rather than total investment returns, meaning rental income, taxes, maintenance, transaction costs, and financing costs are not included.
Where Real Estate Beat Inflation
The table below shows cumulative housing returns before and after inflation across 57 countries.
| Country | Total Before Inflation | Total After Inflation |
|---|---|---|
 Israel Israel |
+206% | +101% |
 Hong Kong Hong Kong |
+175% | +81% |
 Switzerland Switzerland |
+131% | +52% |
 India India |
+127% | +52% |
 Chile Chile |
+130% | +51% |
 Iceland Iceland |
+128% | +50% |
 United States United States |
+126% | +49% |
 Philippines Philippines |
+121% | +46% |
 Portugal Portugal |
+106% | +35% |
 Estonia Estonia |
+102% | +33% |
 Singapore Singapore |
+101% | +32% |
 Malaysia Malaysia |
+100% | +32% |
 New Zealand New Zealand |
+99% | +31% |
 Czechia Czechia |
+94% | +28% |
 Australia Australia |
+93% | +27% |
 Hungary Hungary |
+90% | +25% |
 Thailand Thailand |
+90% | +25% |
 Peru Peru |
+89% | +24% |
 Mexico Mexico |
+82% | +19% |
 Austria Austria |
+76% | +16% |
 Poland Poland |
+67% | +13% |
 Lithuania Lithuania |
+69% | +11% |
 Canada Canada |
+69% | +11% |
 Colombia Colombia |
+65% | +9% |
 Türkiye Türkiye |
+60% | +8% |
 Serbia Serbia |
+64% | +8% |
 Luxembourg Luxembourg |
+63% | +7% |
 Slovakia Slovakia |
+56% | +3% |
 North Macedonia North Macedonia |
+49% | -2% |
 Croatia Croatia |
+43% | -6% |
 Malta Malta |
+43% | -6% |
 Netherlands Netherlands |
+43% | -6% |
 Latvia Latvia |
+43% | -6% |
 Sweden Sweden |
+41% | -8% |
 Germany Germany |
+38% | -10% |
 Bulgaria Bulgaria |
+34% | -12% |
 Slovenia Slovenia |
+31% | -14% |
 Denmark Denmark |
+30% | -15% |
 United Kingdom United Kingdom |
+28% | -16% |
 Norway Norway |
+27% | -16% |
 Belgium Belgium |
+25% | -18% |
 China China |
+23% | -19% |
 South Korea South Korea |
+13% | -26% |
 Ireland Ireland |
+10% | -28% |
 Indonesia Indonesia |
+3% | -32% |
 Brazil Brazil |
+3% | -32% |
 Spain Spain |
+1% | -33% |
 Japan Japan |
-1% | -35% |
 France France |
-1% | -35% |
 South Africa South Africa |
-9% | -40% |
 Romania Romania |
-12% | -41% |
 Finland Finland |
-11% | -42% |
 Morocco Morocco |
-14% | -44% |
 Greece Greece |
-16% | -45% |
 Cyprus Cyprus |
-23% | -50% |
 Italy Italy |
-24% | -50% |
 Russia Russia |
-46% | -63% |
Despite large nominal gains across many housing markets, the median country recorded a 2% decline in real dollar terms. Switzerland and India tied for third at 52%, while Chile gained 51% and Iceland gained 50%.
Because prices are measured in U.S. dollars, exchange-rate movements can significantly affect the ranking. Local factors such as housing supply, demand, and economic growth also shape property values, while affordability depends heavily on the relationship between home prices and incomes.
Why Some Markets Fell Behind
Over a 17-year period, weaker currencies and slower home-price growth weighed heavily on returns in some markets.
At the other end of the ranking, Russia recorded the steepest decline at 63%, followed by Italy and Cyprus at 50% each. Greece fell 45%, while Finland declined 42%. Differences in demographics, economic growth, currencies, and housing supply can all influence outcomes. Across Europe, the share of people living in houses versus apartments also highlights how housing markets differ structurally.
What Could Shape Future Returns?
The factors that drove the wide gaps in this ranking will continue to matter. Inflation can erode nominal housing gains, while currency movements can amplify or reduce returns when property values are measured in U.S. dollars.
Interest rates are another key factor. Lower borrowing costs can support housing demand and prices, while higher rates can weigh on affordability. Together with local supply, demographics, and economic growth, these forces could continue to produce very different real estate returns across countries.
Learn More on the Voronoi App
To see where property carries the steepest price tags today, explore The World’s Most Expensive Real Estate Markets on the Voronoi app.
- Source: https://www.visualcapitalist.com/cp/ranked-real-estate-returns-across-57-countries-since-2008/