Ranked: The Countries Using AI Tools the Most
Key Takeaways
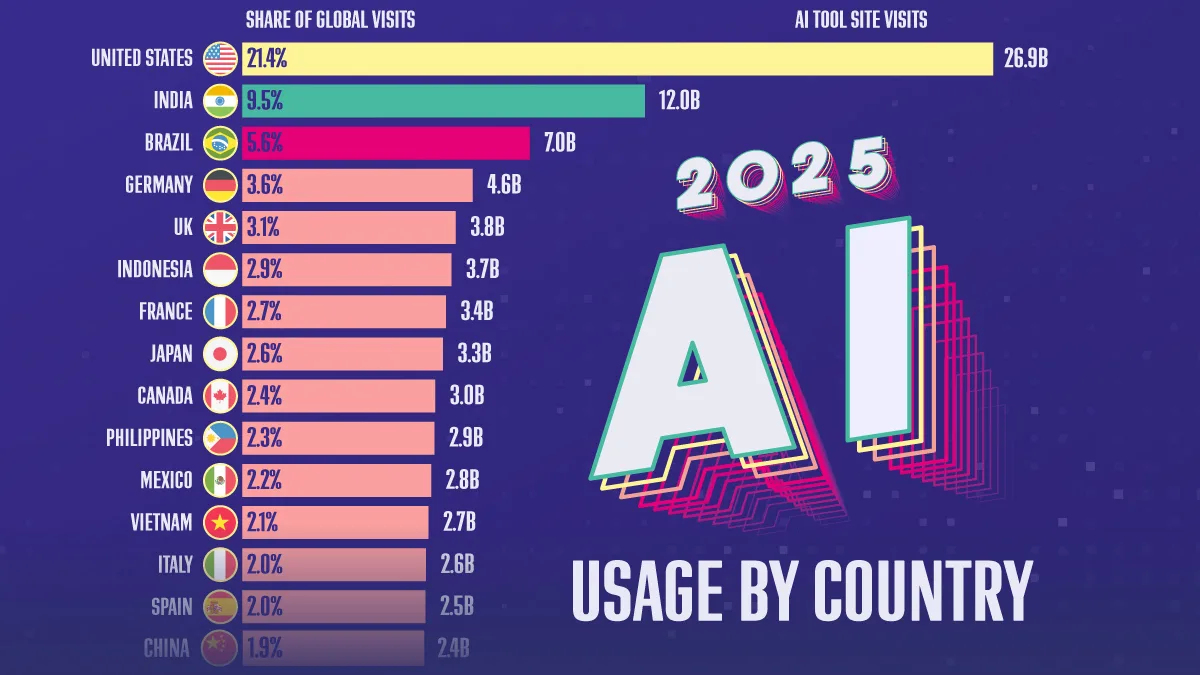
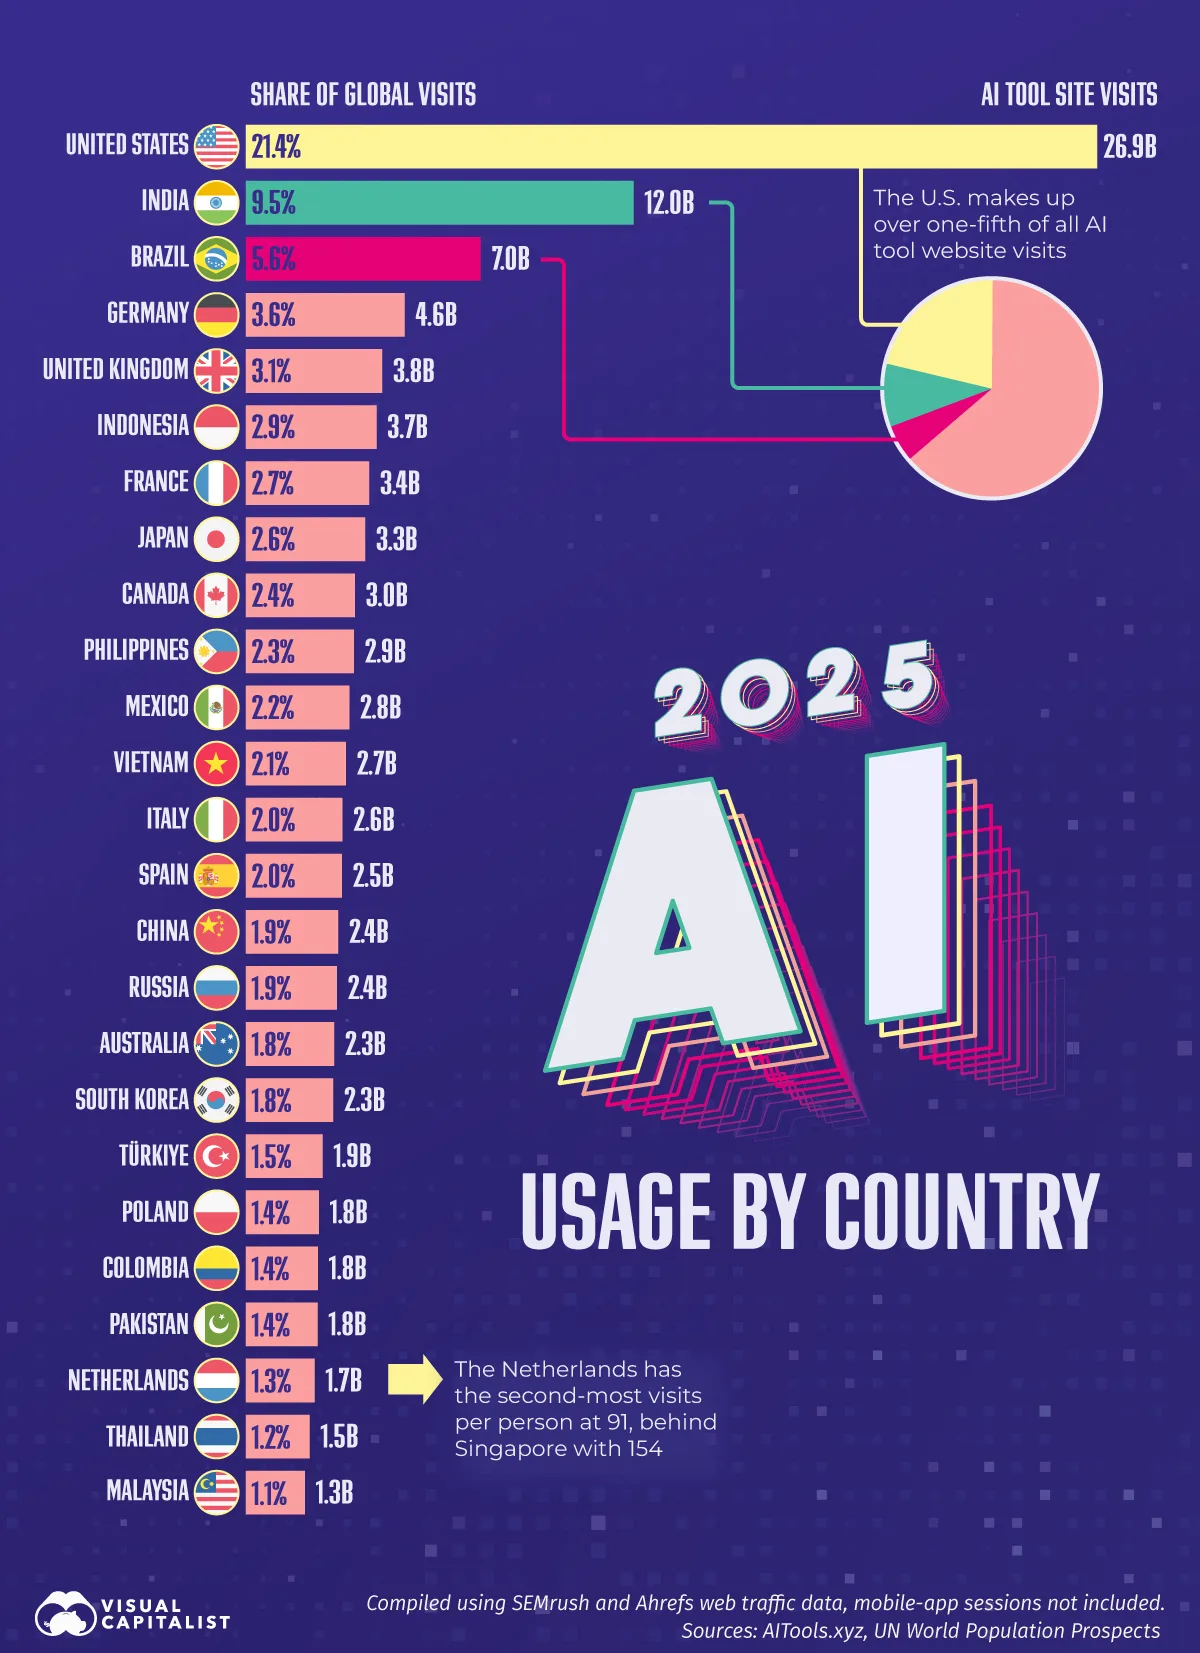
- The U.S. generated 26.9 billion visits to AI tool websites in 2025, or 21.4% of the global total, more than India, Brazil, and Germany combined.
- India ranks second with 12.0 billion visits and Brazil third with 7.0 billion, ahead of every European country.
- China ranks just 15th at 2.4 billion visits, partly because this dataset excludes mobile-app usage.
AI tools drew 125.7 billion website visits in 2025, up 46% from the year before.
This graphic ranks the countries that generated the most visits to AI tool websites in 2025, using data from AITools.xyz, which compiles SEMrush and Ahrefs traffic estimates across more than 9,500 AI tool sites.
The metric counts website visits, not users. One person can make many visits, and visits to different tools are counted separately. Mobile-app sessions are also excluded, which can understate usage in app-first markets such as China.
The U.S. Makes Up One in Five AI Visits Worldwide
The gap between first and second place is substantial: U.S. traffic was more than double India’s, while the top three countries together generated 36.5% of AI tool website visits worldwide.
The table below shows the 30 countries with the most visits to AI tool websites in 2025, along with each country’s share of global visits:
| Rank | Country | AI Tool Website Visits in 2025 | |
|---|---|---|---|
| Visits (Billions) | Share of Global Visits (%) | ||
| 1 |  United States United States |
26.92 | 21.4 |
| 2 |  India India |
11.96 | 9.5 |
| 3 |  Brazil Brazil |
7.02 | 5.6 |
| 4 |  Germany Germany |
4.57 | 3.6 |
| 5 |  United Kingdom United Kingdom |
3.84 | 3.1 |
| 6 |  Indonesia Indonesia |
3.66 | 2.9 |
| 7 |  France France |
3.42 | 2.7 |
| 8 |  Japan Japan |
3.29 | 2.6 |
| 9 |  Canada Canada |
2.96 | 2.4 |
| 10 |  Philippines Philippines |
2.93 | 2.3 |
| 11 |  Mexico Mexico |
2.78 | 2.2 |
| 12 |  Vietnam Vietnam |
2.67 | 2.1 |
| 13 |  Italy Italy |
2.56 | 2.0 |
| 14 |  Spain Spain |
2.54 | 2.0 |
| 15 |  China China |
2.42 | 1.9 |
| 16 |  Russia Russia |
2.38 | 1.9 |
| 17 |  Australia Australia |
2.29 | 1.8 |
| 18 |  South Korea South Korea |
2.26 | 1.8 |
| 19 |  Türkiye Türkiye |
1.92 | 1.5 |
| 20 |  Poland Poland |
1.80 | 1.4 |
| 21 |  Colombia Colombia |
1.77 | 1.4 |
| 22 |  Pakistan Pakistan |
1.76 | 1.4 |
| 23 |  Netherlands Netherlands |
1.66 | 1.3 |
| 24 |  Thailand Thailand |
1.50 | 1.2 |
| 25 |  Malaysia Malaysia |
1.35 | 1.1 |
| 26 |  Peru Peru |
1.33 | 1.1 |
| 27 |  Argentina Argentina |
1.29 | 1.0 |
| 28 |  Ukraine Ukraine |
1.13 | 0.9 |
| 29 |  Taiwan Taiwan |
1.13 | 0.9 |
| 30 |  Nigeria Nigeria |
1.03 | 0.8 |
Brazil ranks third with 7.0 billion visits, well ahead of Germany (4.6B), the UK (3.8B), and France (3.4B).
Population helps explain the strong showing from India and Brazil, but several Southeast Asian markets also rank remarkably high. Indonesia places sixth with 3.7 billion visits, while the Philippines ranks 10th with 2.9 billion.
Both finish ahead of larger or wealthier economies such as Italy (2.6B), Spain (2.5B), and South Korea (2.3B).
Why China Ranks So Low in AI Tool Site Visits
China is the world’s second-largest AI power by model development, yet it ranks 15th here with 2.4 billion website visits.
China’s low position partly reflects what this dataset measures. Major Western AI tools such as ChatGPT, Gemini, and Claude have limited availability in China, while domestic assistants such as DeepSeek, Doubao, and Quark attract significant usage through mobile apps. Because this ranking measures website traffic and excludes app sessions, it should not be interpreted as a measure of China’s total AI usage.
The U.S. lead also looks different depending on the metric. The country generates the most AI tool website traffic by a wide margin, yet Microsoft ranks it only 21st for AI adoption, with 31.3% of working-age adults using AI regularly compared with 70.1% in the UAE.
As this map of AI adoption by country shows, the highest penetration rates are typically found in much smaller economies.
Learn More on the Voronoi App
To learn more about AI usage, check out this map comparing AI usage by businesses across the United States.