
Trading Under Trump: Lessons from 2017–2021
With the second term of Donald Trump underway, all eyes are on the markets to see how they react to this changing of the guards.
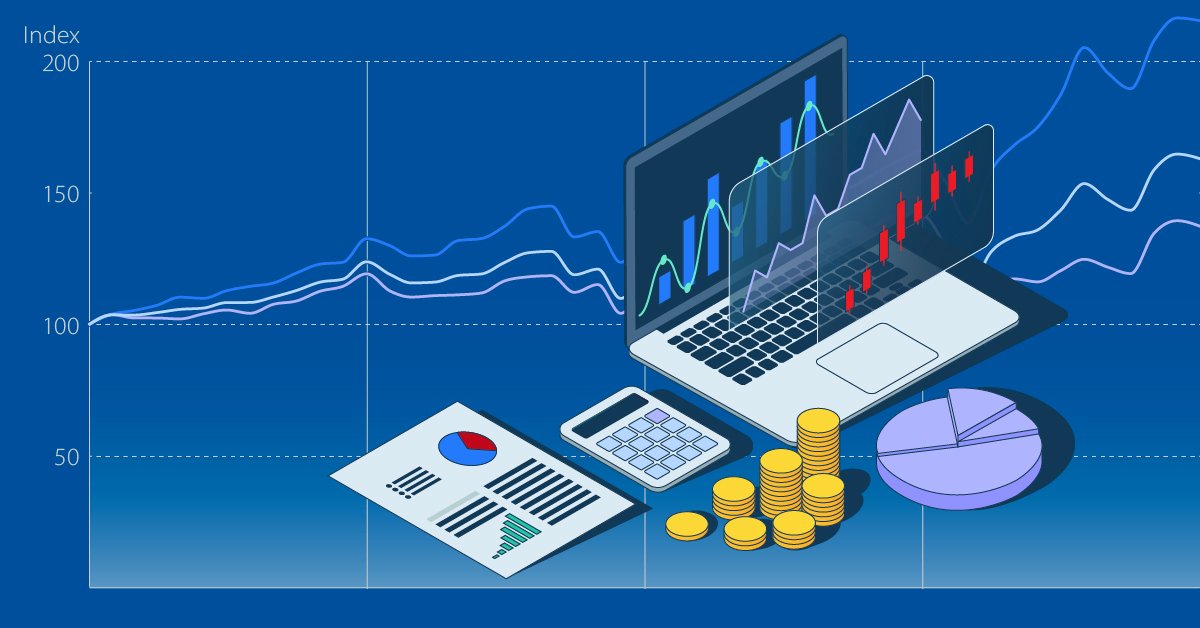
This visualization, created in partnership with New York Life Investments, explores the sectors and regions that thrived last time, along with those that struggled. Past trends may hint at what’s ahead.
U.S. Equities
With his protectionist stance, U.S. equities generally performed well throughout Trump’s first term. However, there were large discrepancies among the indexes.
The overall S&P 500 returned 63.0% over Trump’s first term as the index rose steadily. Other than a brief drop induced by the COVID-19 pandemic, the index consistently trended higher.
| Index/Asset | Performance 2017-2021 (%) |
|---|---|
| Bitcoin | +3,329.1 |
| S&P 500 Growth | +115.4 |
| S&P 500 | +63.0 |
| Gold | +52.7 |
| MSCI EM | +46.2 |
| S&P 500 Value | +37.3 |
| MSCI Europe | +20.8 |
| MSCI China | +7.4 |
| U.S. Dollar | -9.0 |
Prior to the 2020 plunge, the U.S. stock market had been in the longest bull run in history, which lasted from March 2009 to March 2020. As is typically the case during bull markets, growth outperformed value.
The S&P 500 value index returned 37.3% over the term. In contrast, the growth index returned 115.4%.
International Equities
International equities, though strong overall, tended to show weaker performance throughout the January 2017 to 2021 period.
Emerging markets witnessed the strongest growth of this group, returning 46.2% during this period as trade and foreign direct investment to the region increased.
However, the U.S.-China trade war, which began in 2018 when Trump imposed additional tariffs on Chinese goods, weighed on the country’s equity market performance. MSCI China returned only 7.4% over this timeframe. Conversely, Europe gained 20.8%.
Other Assets
There’s more to investing than just equities. How did three major alternatives—gold, the U.S. dollar, and bitcoin—perform during Trump’s first term?
Bitcoin gained more than 3,300% over this timeframe, pushing up past $40k during the COVID-19 stock market panic. Gold gained 52.7%—underperforming the S&P 500 by roughly 10 percentage points.
The U.S. dollar weakened as it was pressured by Fed rate cuts in 2018 and 2019. In fact, the currency dropped by 9.0%.
Prepare for Trump 2.0
Investors may not be able to predict the future, but past market winners under Trump may reveal new opportunities.

Explore more insights from New York Life Investments
-

 Markets5 hours ago
Visualizing the Global Stock Market by Sector
We break down the $124 trillion global stock market by sector in 2024, highlighting the dominance of tech and financials.
-

 Markets3 days ago
Ranked: The Worst Performing Stocks in the S&P 500 (2005-2024)
While the S&P 500 has seen an average annual return of 10.4% since 2005, the 20 worst performing stocks have returned -0.8%.
-

 Markets3 days ago
Charted: Average S&P 500 Return by Month Since 1950
Discover the average S&P 500 return by month since 1950 and see which months have historically been the strongest and weakest for U.S. stocks.
-

 Markets1 week ago
Charted: S&P 500 Market Concentration Over 145 Years
The top 10 stocks of the S&P 500 have made up an average about one-quarter (24%) of the index from 1880 to 2010.
-

 Markets2 weeks ago
Charted: The U.S. Stock Market vs. Rest of World (1979-2025)
International stocks are outpacing the S&P 500 so far in 2025. Here is a historical look at their returns against U.S. stocks since 1979.
-

 Markets2 weeks ago
The $124 Trillion Global Stock Market, Sorted by Region
In this graphic, we show the world’s 48,000 publicly-traded companies, collectively valued at $124 trillion.
The post Trading Under Trump: Lessons from 2017-2021 appeared first on Visual Capitalist.


var disqus_shortname = “visualcapitalist.disqus.com”;
var disqus_title = “Trading Under Trump: Lessons from 2017-2021”;
var disqus_url = “https://www.visualcapitalist.com/sp/trading-under-trump/”;
var disqus_identifier = “visualcapitalist.disqus.com-175783”;