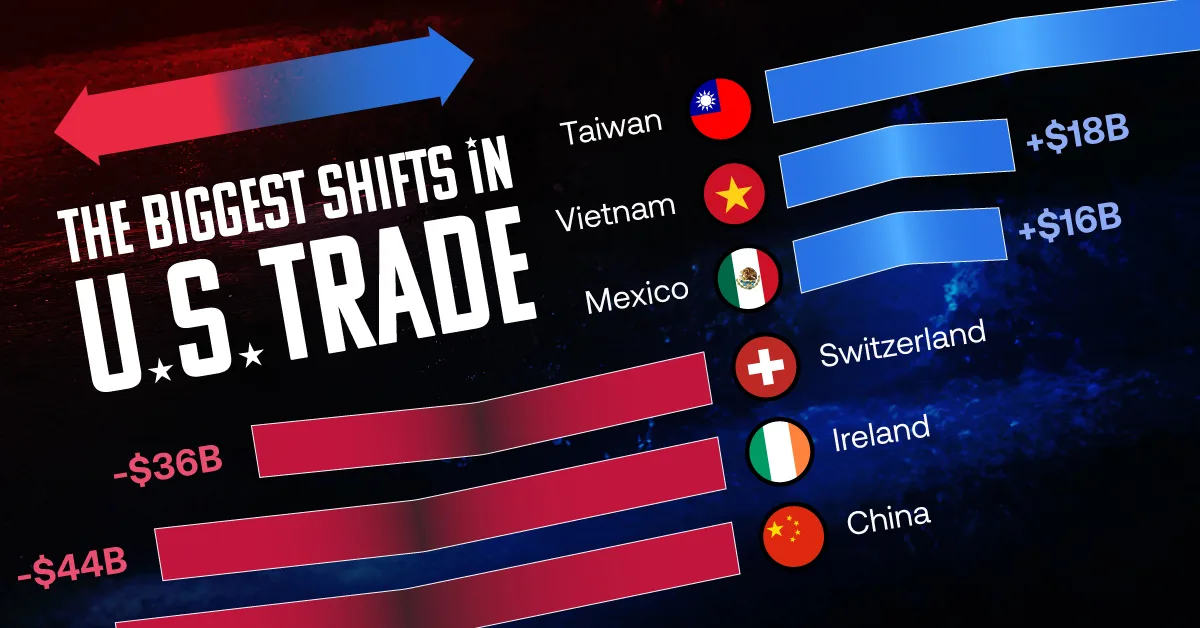
U.S. Trade is Falling With China—but Surging With Taiwan and Vietnam
U.S. trade patterns are shifting as imports and exports with China and parts of Europe decline. On the other end of the scale, trade with countries like Taiwan, Vietnam, and Mexico is rising.
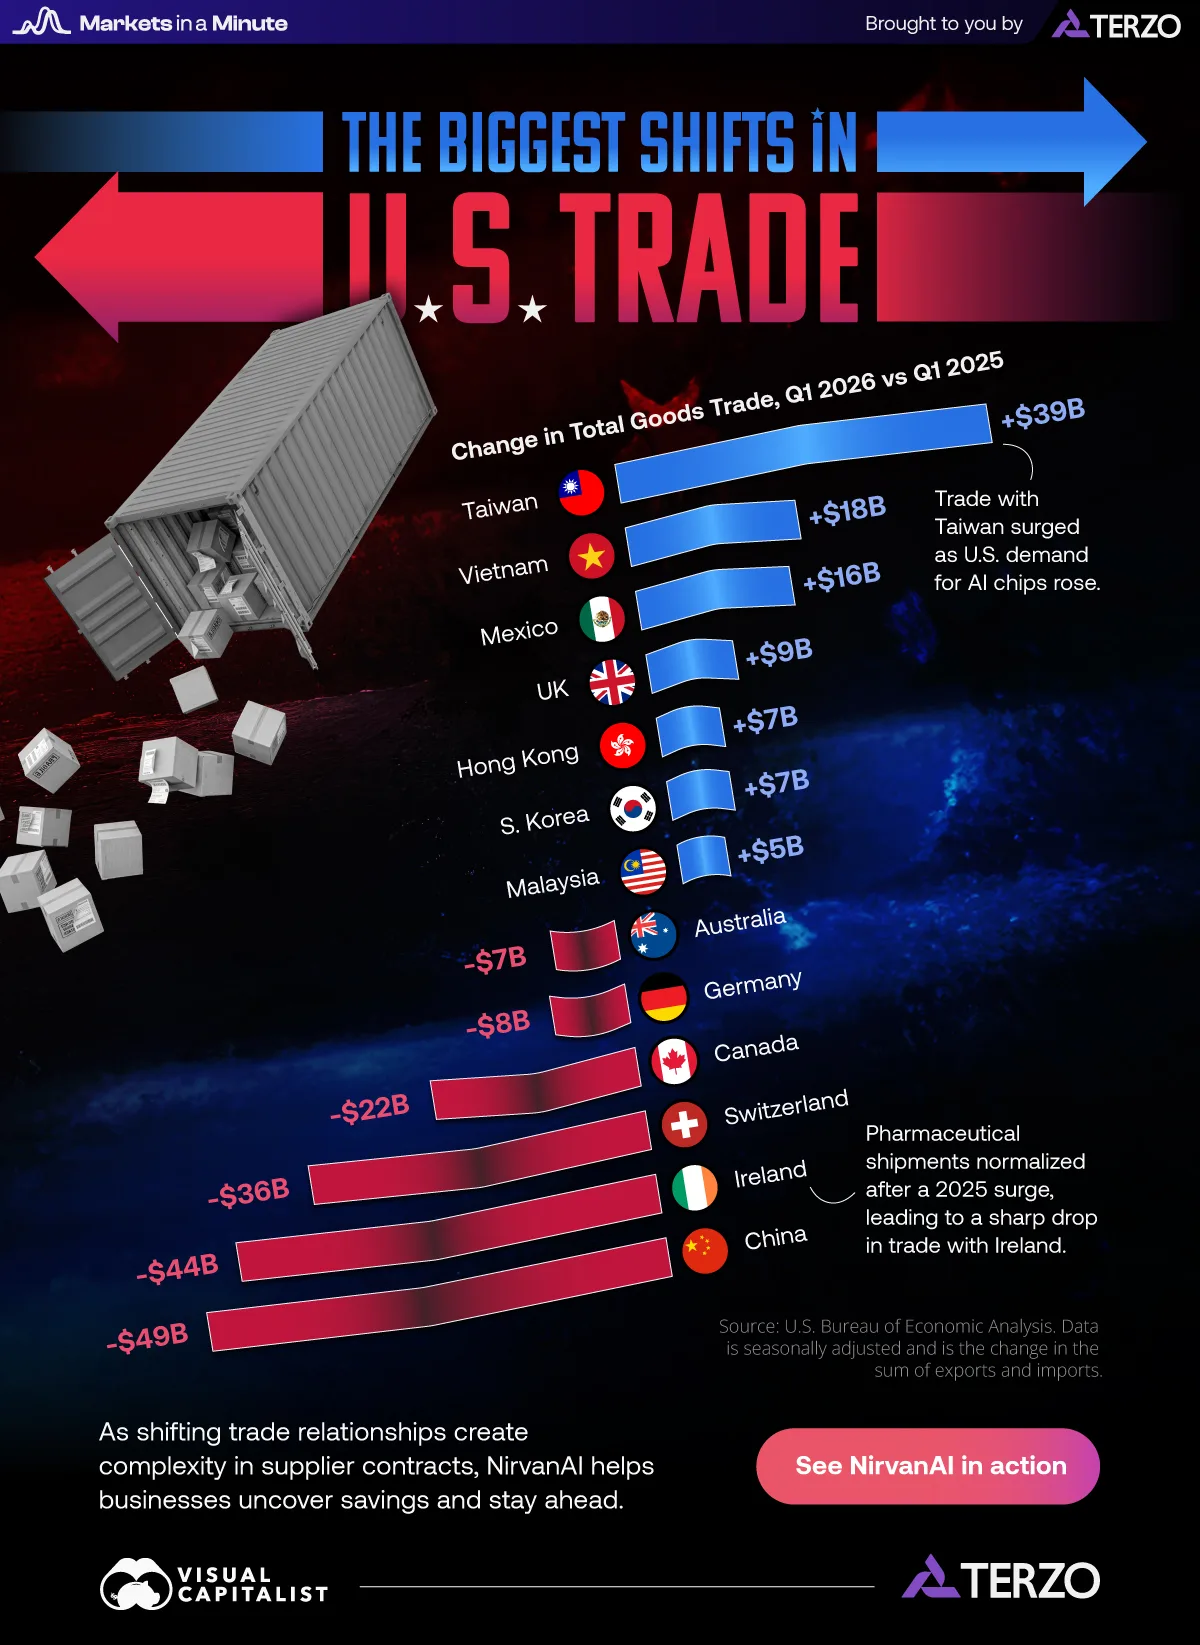
In this graphic, produced in partnership with Terzo, we look at the biggest changes in the first quarter of 2026 compared to the same time last year. It’s part of our Markets in a Minute series, which delivers quick economic insights.
The Biggest Drops in U.S. Trade
With a drop of nearly $50 billion, the U.S. has decreased trade with China the most. While the trade war is estimated to have created billions in tariff revenue for the U.S., both countries have increasingly shifted trade toward other partners and supply chains.
| Trading Partner | Change in Total Goods Trade, Q1 2026 vs Q1 2025 |
|---|---|
 China China |
-$49B |
 Ireland Ireland |
-$44B |
 Switzerland Switzerland |
-$36B |
 Canada Canada |
-$22B |
 Germany Germany |
-$8B |
 Australia Australia |
-$7B |
Source: U.S. Bureau of Economic Analysis. Data is seasonally adjusted and is the change in the sum of exports and imports from the first quarter of 2025 to the first quarter of 2026.
America’s trade with Ireland also plummeted. In 2025, Ireland’s pharmaceutical exports to the U.S. surged in anticipation of potential tariffs. The vast majority of these exports were hormones for GLP-1 drugs. Exports have since levelled off following the 2025 spike, causing the large drop.
The Biggest Rises in U.S. Trade
On the other hand, U.S. trade has increased the most with Taiwan. U.S. demand for semiconductors and servers surged amid the AI boom, and many of these products were exempt from American tariffs.
| Trading Partner | Change in Total Goods Trade, Q1 2026 vs Q1 2025 |
|---|---|
 Taiwan Taiwan |
+$39B |
 Vietnam Vietnam |
+$18B |
 Mexico Mexico |
+$16B |
 UK UK |
+$9B |
 Hong Kong Hong Kong |
+$7B |
 S. Korea S. Korea |
+$7B |
 Malaysia Malaysia |
+$5B |
Source: U.S. Bureau of Economic Analysis. Data is seasonally adjusted and is the change in the sum of exports and imports from the first quarter of 2025 to the first quarter of 2026.
Vietnam also traded significantly more with the U.S. in the first quarter of 2026. Many U.S. companies have shifted production from China to Vietnam. Some Chinese companies have followed a similar path, relocating to Vietnam as a workaround to avoid tariffs.
Managing Trade Complexity
As companies shift suppliers and manufacturing across countries, businesses are managing increasingly complex contracts. Tracking pricing changes, renewals, and supplier terms has become more important as global trade patterns evolve.

NirvanAI helps you unlock hidden savings in your contracts with AI-powered insights.
-

 Housing2 weeks ago
Where Luxury Housing Prices Surged the Most in 2025
Luxury housing prices climbed in 2025, led by Tokyo’s nearly 60% jump. See which global cities saw the fastest growth.
-
 GDP3 weeks ago
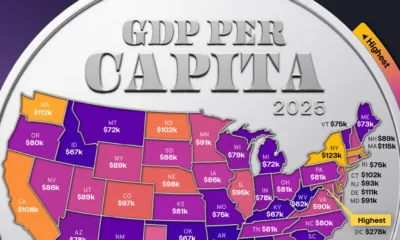
Which U.S. States Have the Highest GDP per Capita
See how GDP per capita varies widely across U.S. states, from under $60K in Mississippi to nearly $280K in Washington, D.C.
-
 GDP4 weeks ago
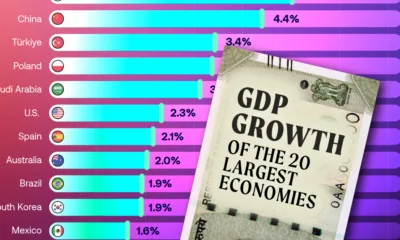
Ranked: 2026 GDP Growth Forecasts for the World’s 20 Largest Economies
Which major economies are set to grow the fastest in 2026? Explore GDP growth projections for the world’s 20 largest countries.
-
 Currency1 month ago
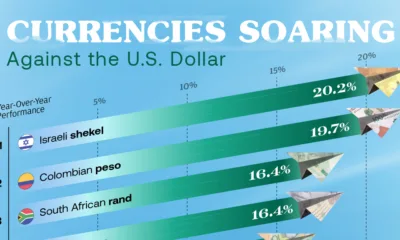
Ranked: Currencies Soaring Against the U.S. Dollar
See the top-performing currencies against the U.S. dollar and what’s driving their gains, from strong foreign investment to interest rates.
-

 Money2 months ago
Breaking Down the $417 Billion Sports Industry
At an estimated $417 billion in total value today, the sports market continues to expand rapidly. What are the top revenue streams?
-

 Business3 months ago
Ranked: The World’s Top Startup Hubs
Startup ecosystems are emerging around the world, but a small group of countries continues to lead the charge.
-

 Inflation3 months ago
Ranked: The Biggest Price Shocks Businesses Are Facing
Wholesale turkey prices have gone up a whopping 70%. Where else are businesses being hit by high inflation?
-

 Business3 months ago
What a CFO’s Hour is Worth: Ranking the Top Earners
Top CFOs are earnings thousands per hour in compensation. Who’s leading the pack, and how much are they making?
-

 Markets4 months ago
Breaking Down America’s $13 Trillion ETF Market
This visualization breaks down the U.S. $13.4 trillion ETF market by asset class, showing how ETFs allocate capital across equities, bonds, and more.
-
 Markets5 months ago
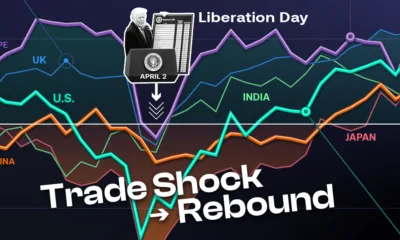
2025 in Review: The Ups, Downs, and Returns of Global Markets
Which country led stock markets in 2025? See the biggest shocks, rebounds, and year-end returns in this global recap.
-

 Markets5 months ago
Mapped: The Biggest Housing Bubble Risks Globally
Which global cities are most at risk of a housing bubble? This new map ranks the world’s most overheated real estate markets.
-

 Technology6 months ago
Ranked: The Top Factors That Build AI Trust
Want AI your team will trust? Pull back the curtain on the top factors that make people believe in artificial intelligence.
-

 Technology6 months ago
Ranked: AI Hallucination Rates by Model
Find out how common AI hallucination is for leading models, and what that means for the businesses that rely on them.
-

 Technology6 months ago
The Dangers of AI: Visualizing the Top Risks Companies Face
Among the dangers of AI, one stands apart as causing trouble for almost a third of companies. What do leaders need to know?
-

 Business6 months ago
Ranked: Which Universities Build the Most Entrepreneurs?
Which university has had the most alumni become entrepreneurs in the last decade? Hint: its not Stanford or Harvard.
-
 Economy6 months ago
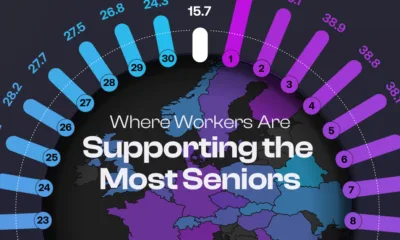
Mapped: Where Workers Are Supporting the Most Seniors
In many advanced economies, the number of retirees is climbing while the working-age population shrinks. What are the countries where workers are supporting the most seniors?
-
 Economy7 months ago
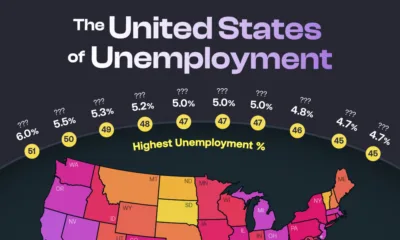
The United States of Unemployment
The national unemployment rate for the U.S. rose to 4.3% in August 2025. But that figure masks vast differences in local labor market health across states.
-
 Markets7 months ago
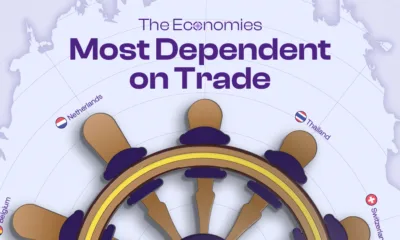
Ranked: The Economies Most Dependent on International Trade
A trade war has threatened economic ties in 2025. Which economies are most exposed to these shifts in international trade?
-
 Economy7 months ago
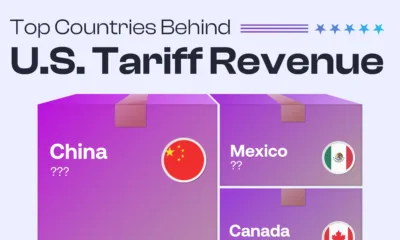
Top Countries Behind U.S. Tariff Revenue
Tariff rates vary by country, as does the value of goods each nation exports to the U.S. Which countries contribute the most?
-

 Business7 months ago
Industries Hiring and Firing the Most Employees
As the U.S. labor market cools, which industries are still hiring—and which are cutting back their workforces?
-
 Markets8 months ago
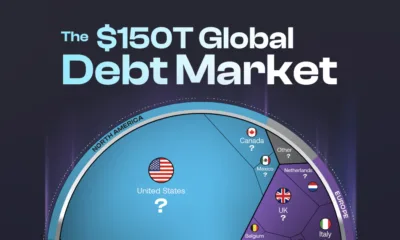
The $150T Global Debt Market
Global debt continues to climb, reaching $150T in Q1 2025. Which countries carry the heaviest burdens?
-
 Money8 months ago
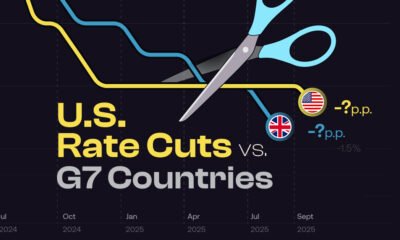
NEW: Fed Rate Cuts vs. Other G7 Countries
How do Fed rate cuts in the U.S. compare with the interest rate changes in other G7 countries, and what does it mean for business?
-
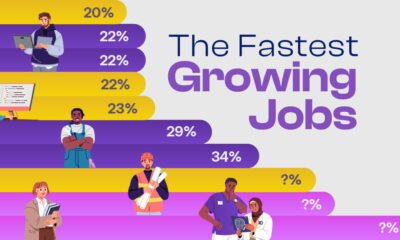
 Jobs8 months ago
Ranked: The Fastest Growing Jobs (2024-2034)
Explore the fastest growing jobs by projected growth rate, plus salary insights, in a rapidly changing job market.
-

 Investor Education9 months ago
The $127 Trillion Global Stock Market in One Giant Chart
This graphic pieces together the $127T global stock market to reveal which countries and regions dominate—and how much equity they control.
-

 Personal Finance9 months ago
Late to the Ladder: The Rise in First-Time Home Buyers’ Age
The median age of first-time home buyers has reached a historic high. See just how long it’s taking people to get on the property ladder.
-

 Markets10 months ago
Unpacking Real Estate Ownership by Generation (1991 vs. 2025)
The Silent Generation’s share of real estate has dropped dramatically as people age, but how have Baby Boomers, Gen X, and Millennials fared?
-
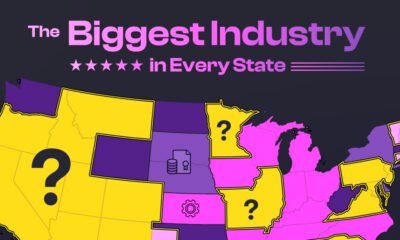
 Business10 months ago
America’s Economic Engines: The Biggest Industry in Every State
Real estate is the biggest industry by GDP in 26 states. Find out why it dominates—and what fuels the rest of the country.
-
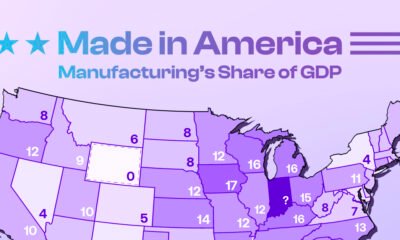
 Maps10 months ago
Mapped: Manufacturing as a Share of GDP, by U.S. State
Tariffs are rising to boost American-made goods. Which states gain the most—and least—from manufacturing today?
-

 Technology11 months ago
Profit Powerhouses: Ranking The Top 10 U.S. Companies by Net Income
Collectively, the ten most profitable U.S. companies have a net income of $684 billion—more than the entire GDP of Belgium.
-

 Money11 months ago
Millionaire Hubs: Mapping the World’s Wealthiest Cities
New York City has the highest millionaire population globally. Which other cities attract the world’s wealthiest?
-
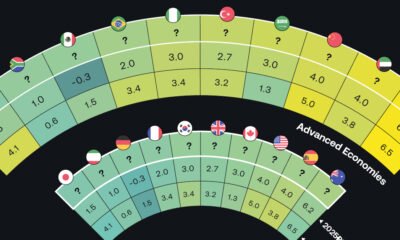
 Economy11 months ago
Tomorrow’s Growth: GDP Projections in Key Economies
The global economy is expected to have slighter slower growth going forward. Which countries are on track to have the biggest GDP increases?
-
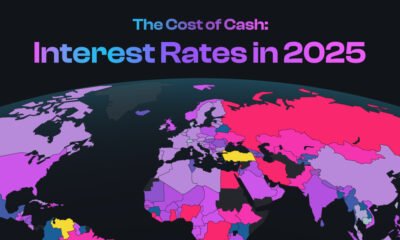
 Money1 year ago
Mapped: Interest Rates by Country in 2025
The U.S. has kept their target rate the same at 4.25-4.50%. What do interest rates look like in other countries amid economic uncertainty?
-
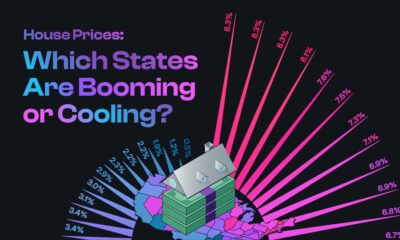
 Markets1 year ago
U.S. Housing Prices: Which States Are Booming or Cooling?
The national housing market saw a 4.5% rise in house prices. This graphic reveals which states had high price growth, and which didn’t.
-
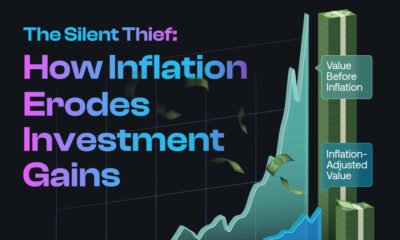
 Investor Education1 year ago
The Silent Thief: How Inflation Erodes Investment Gains
If you held a $1,000 investment from 1975-2024, this chart shows how the inflation rate can drastically reduce the value of your money.
-

 Politics1 year ago
Trade Tug of War: America’s Largest Trade Deficits
Trump cites trade deficits—the U.S. importing more than it exports—as one reason for tariffs. Which countries represent the largest deficits?