Who Trades the Most Within BRICS?
Key Takeaways:
- China is the dominant exporter in the dataset, with $523 billion in goods exports to the other nine BRICS members shown.
- The largest export flow is China’s $136 billion in exports to India, followed by Russia’s $124 billion in exports to China.
- Export relationships vary significantly in size, from flows exceeding $100 billion to those worth less than $100 million.
BRICS now has 11 members: Brazil, Russia, India, China, Saudi Arabia, South Africa, Egypt, Ethiopia, Indonesia, Iran, and the UAE. Together, they span several regions and have very different export profiles.
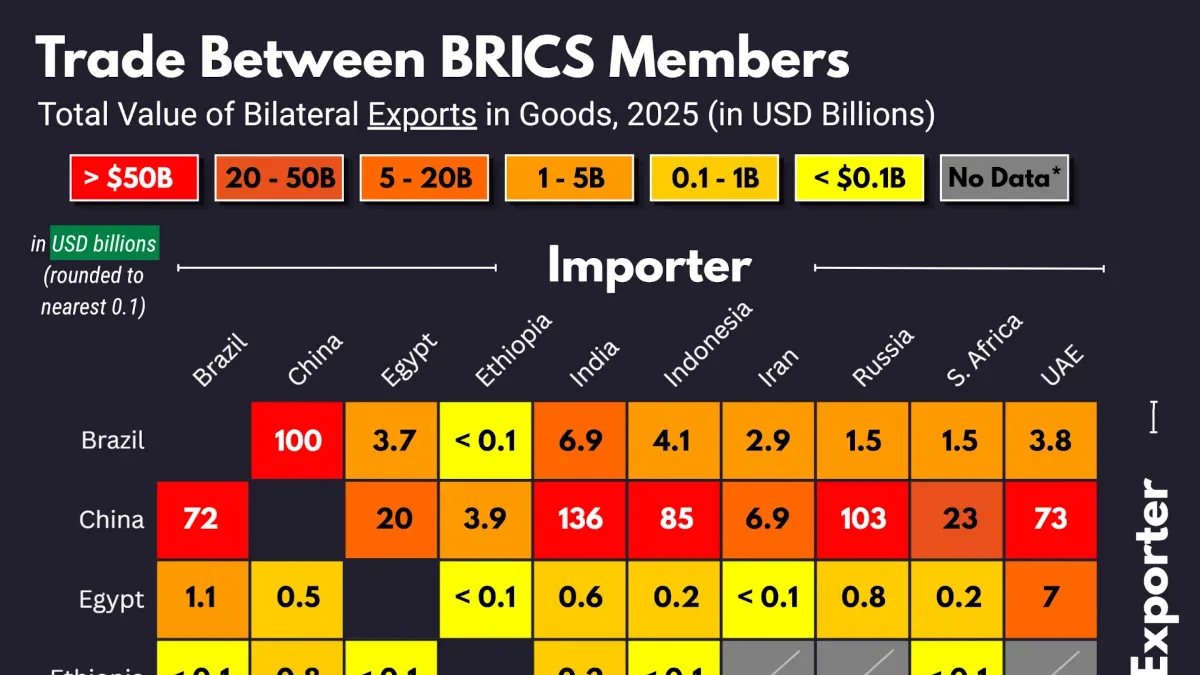
This graphic, created by Iswardi Ishak, visualizes 2025 goods exports between 10 BRICS members using data from the International Trade Centre.
Each cell shows exports from one member to another, rather than total two-way trade between the two countries. Saudi Arabia is not included in the matrix shown.
China Is the Biggest Exporter in the Matrix
The following table shows the value of goods exported from one BRICS member to another in 2025, based on ITC’s Trade Map.
| Exporting Country | Importing Country | Total Value of Exports (in USD Billions) |
|---|---|---|
 Brazil Brazil |
 China China |
100 |
| Brazil |
 Egypt Egypt |
3.7 |
| Brazil |
 Ethiopia Ethiopia |
0.03 |
| Brazil |
 India India |
6.9 |
| Brazil |
 Indonesia Indonesia |
4.1 |
| Brazil |
 Iran Iran |
2.9 |
| Brazil |
 Russia Russia |
1.5 |
| Brazil |
 South Africa South Africa |
1.5 |
| Brazil |
 UAE UAE |
3.8 |
| China |
Brazil |
72 |
| China |
Egypt |
20 |
| China |
Ethiopia |
3.9 |
| China |
India |
136 |
| China |
Indonesia |
85 |
| China |
Iran |
6.9 |
| China |
Russia |
103 |
| China |
South Africa |
23 |
| China |
UAE |
73 |
| Egypt |
Brazil |
1.1 |
| Egypt |
China |
0.49 |
| Egypt |
Ethiopia |
0.08 |
| Egypt |
India |
0.64 |
| Egypt |
Indonesia |
0.18 |
| Egypt |
Iran |
0.004 |
| Egypt |
Russia |
0.81 |
| Egypt |
South Africa |
0.16 |
| Egypt |
UAE |
7 |
| Ethiopia |
Brazil |
0.001 |
| Ethiopia |
China |
0.78 |
| Ethiopia |
Egypt |
0.03 |
| Ethiopia |
India |
0.2 |
| Ethiopia |
Indonesia |
0.03 |
| Ethiopia |
Iran |
No Data |
| Ethiopia |
Russia |
No Data |
| Ethiopia |
South Africa |
0.01 |
| Ethiopia |
UAE |
No Data |
| India |
Brazil |
6.9 |
| India |
China |
18 |
| India |
Egypt |
4 |
| India |
Ethiopia |
0.47 |
| India |
Indonesia |
4.3 |
| India |
Iran |
1.2 |
| India |
Russia |
4.5 |
| India |
South Africa |
7 |
| India |
UAE |
39 |
| Indonesia |
Brazil |
2.2 |
| Indonesia |
China |
67 |
| Indonesia |
Egypt |
1.9 |
| Indonesia |
Ethiopia |
0.11 |
| Indonesia |
India |
18 |
| Indonesia |
Iran |
0.25 |
| Indonesia |
Russia |
1.9 |
| Indonesia |
South Africa |
0.989 |
| Indonesia |
UAE |
4 |
| Iran |
Brazil |
0.09 |
| Iran |
China |
3 |
| Iran |
Egypt |
0.003 |
| Iran |
Ethiopia |
No Data |
| Iran |
India |
0.5 |
| Iran |
Indonesia |
0.009 |
| Iran |
Russia |
No Data |
| Iran |
South Africa |
0.006 |
| Iran |
UAE |
No Data |
| Russia |
Brazil |
9.4 |
| Russia |
China |
124 |
| Russia |
Egypt |
5.2 |
| Russia |
Ethiopia |
No Data |
| Russia |
India |
59 |
| Russia |
Indonesia |
3 |
| Russia |
Iran |
No Data |
| Russia |
South Africa |
0.5 |
| Russia |
UAE |
No Data |
| South Africa |
Brazil |
0.29 |
| South Africa |
China |
13 |
| South Africa |
Egypt |
0.09 |
| South Africa |
Ethiopia |
0.07 |
| South Africa |
India |
4.7 |
| South Africa |
Indonesia |
0.36 |
| South Africa |
Iran |
0.006 |
| South Africa |
Russia |
0.39 |
| South Africa |
UAE |
3 |
| UAE |
Brazil |
0.63 |
| UAE |
China |
35 |
| UAE |
Egypt |
2.6 |
| UAE |
Ethiopia |
No Data |
| UAE |
India |
67 |
| UAE |
Indonesia |
2.4 |
| UAE |
Iran |
No Data |
| UAE |
Russia |
No Data |
| UAE |
South Africa |
2.6 |
China’s row is the most consistently high-value in the matrix, with exports exceeding $70 billion to five BRICS markets: India, Russia, Indonesia, the UAE, and Brazil.
Russia’s exports to China are another major relationship, reaching $124 billion. Together, these figures show how heavily many of the largest export flows within the group are connected to China.
This concentration is consistent with a broader UN Trade and Development (UNCTAD) analysis, which found that intra-BRICS merchandise exports increased more than 13-fold from 2003 to $1.17 trillion in 2024, with China playing a central role in the network.
Why Some BRICS Export Flows Are So Small
At the other end of the matrix, some export relationships are tiny by comparison. While the largest flows exceed $100 billion, exports between some member pairs amount to less than $100 million.
One reason is that BRICS is an informal, consensus-based grouping rather than a customs union or free-trade area. Its members differ considerably in geography, infrastructure, regulations, and economic specialization.
Ethiopia’s exports to several members, for example, are below $100 million. Missing entries for Iran and Russia should not automatically be interpreted as zero exports, as they may reflect reporting gaps in the underlying dataset. UNCTAD notes that institutional and regulatory differences, along with geopolitical factors, continue to constrain deeper integration.
Learn More on the Voronoi App
To see how the group’s economic weight could evolve, check out BRICS GDP Growth to Triple G7 in 2026 on the Voronoi app.