


Which Economies Have the Largest Ecological Footprints?
How much biologically productive land and water are required to support a population’s resource use and absorb its waste—and how does this footprint vary around the world?
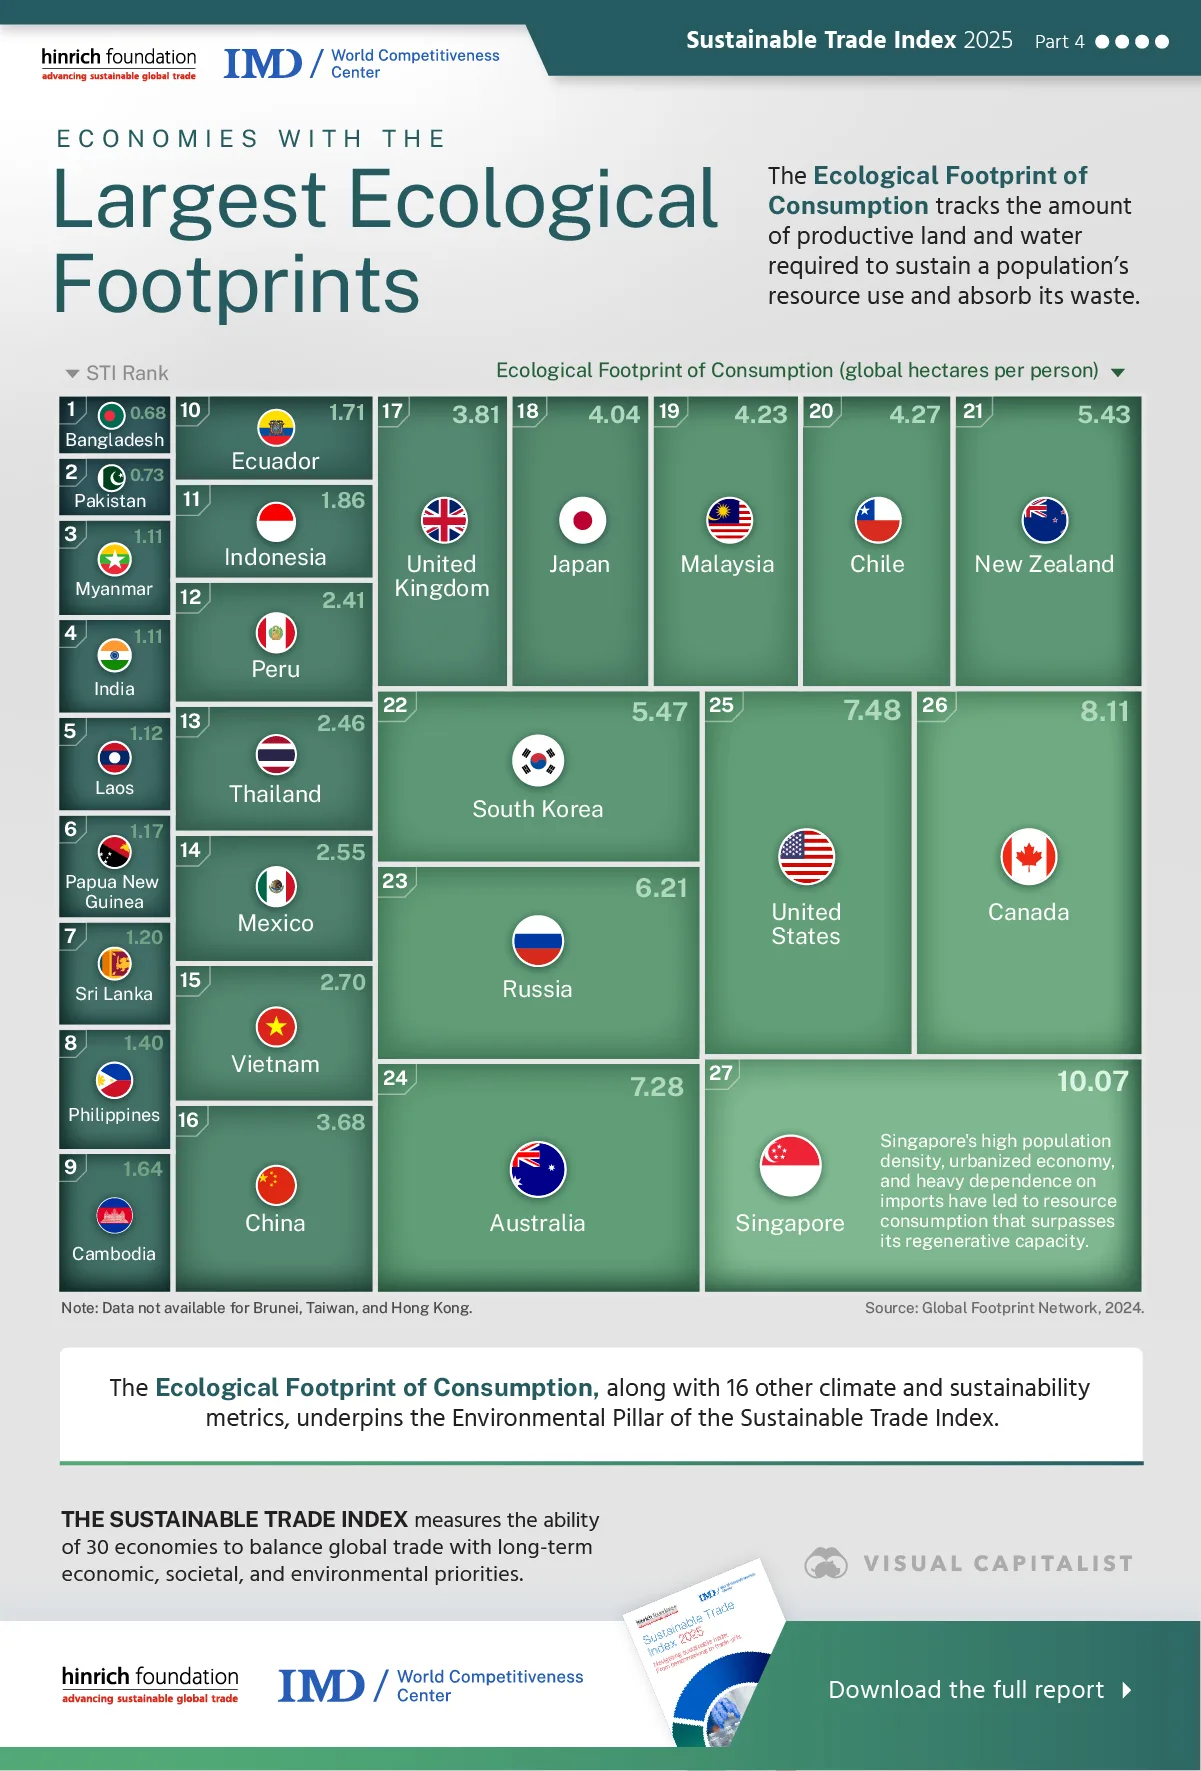
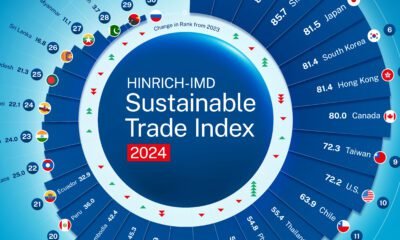
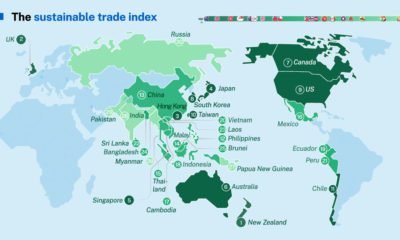
In collaboration with the Hinrich Foundation, this visualization draws on data from the Global Footprint Network to compare ecological footprints across countries, highlighting the varying environmental pressures of consumption.
The analysis comes from the 2025 Sustainable Trade Index (STI), which the Hinrich Foundation produced in collaboration with the IMD World Competitiveness Center.
What Is an Ecological Footprint?
The ecological footprint is a metric that quantifies human demand on nature. It calculates the biologically productive land and water area required to supply the renewable resources a given population consumes (such as food, timber, and energy). It also factors in the land needed to assimilate the waste it produces, particularly carbon dioxide.
The metric provides insight into whether a country’s consumption levels are environmentally sustainable. The higher the ecological footprint a country has, the less sustainable its consumption is given its available resources.
Which Countries’ Consumption Leave the Highest Footprints?
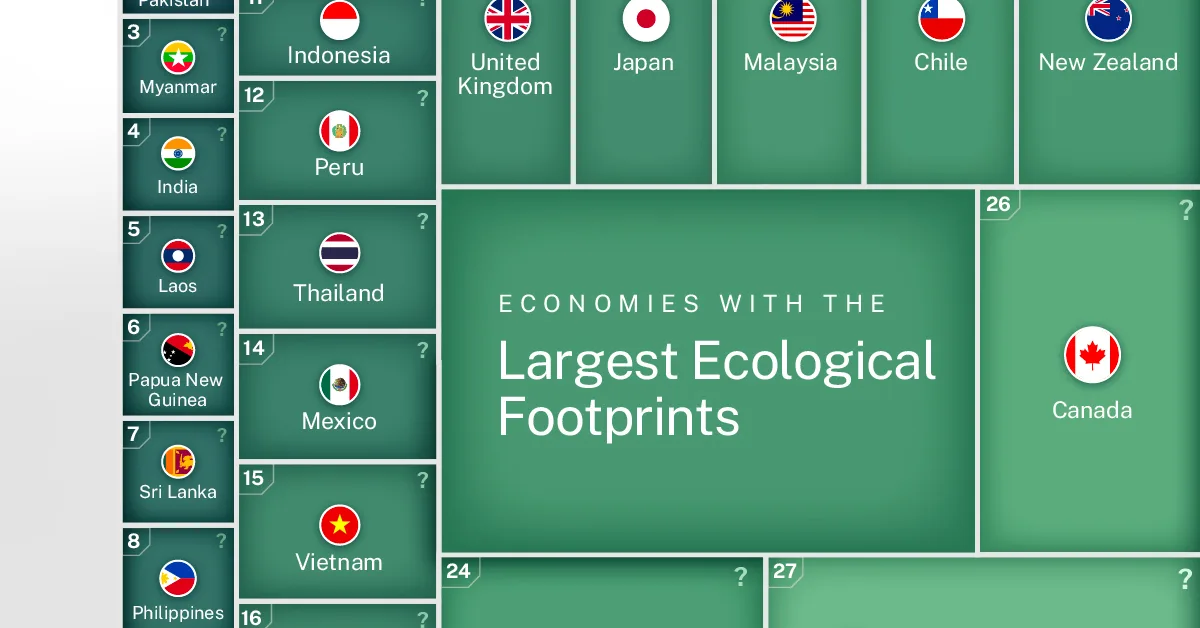
It’s no surprise that developed countries typically have larger ecological footprints than emerging markets. With higher levels of consumption—whether energy, goods, or resources—these nations also generate more waste on a per-person basis.
The country with the highest footprint (which translates into a lower ranking) is Singapore, at 10.1 global hectares per person. It’s followed by Canada (8.1), the U.S. (7.5), Australia (7.3), and Russia (6.2).
| From Smallest to Largest Ecological Footprints | ||
|---|---|---|
| Rank | Country | Ecological Footprint (global hectares) |
| 1 |  Bangladesh Bangladesh |
0.68 |
| 2 |  Pakistan Pakistan |
0.73 |
| 3 |  Myanmar Myanmar |
1.11 |
| 4 |  India India |
1.11 |
| 5 |  Laos Laos |
1.12 |
| 6 |  Papua New Guinea Papua New Guinea |
1.17 |
| 7 |  Sri Lanka Sri Lanka |
1.20 |
| 8 |  Philippines Philippines |
1.40 |
| 9 |  Cambodia Cambodia |
1.64 |
| 10 |  Ecuador Ecuador |
1.71 |
| 11 |  Indonesia Indonesia |
1.86 |
| 12 |  Peru Peru |
2.41 |
| 13 |  Thailand Thailand |
2.46 |
| 14 |  Mexico Mexico |
2.55 |
| 15 |  Vietnam Vietnam |
2.70 |
| 16 |  China China |
3.68 |
| 17 |  United Kingdom United Kingdom |
3.81 |
| 18 |  Japan Japan |
4.04 |
| 19 |  Malaysia Malaysia |
4.23 |
| 20 |  Chile Chile |
4.27 |
| 21 |  New Zealand New Zealand |
5.43 |
| 22 |  South Korea South Korea |
5.47 |
| 23 |  Russia Russia |
6.21 |
| 24 |  Australia Australia |
7.28 |
| 25 |  United States United States |
7.48 |
| 26 |  Canada Canada |
8.11 |
| 27 |  Singapore Singapore |
10.07 |
Among developed markets, the UK ranks most favorably at #17, with an ecological footprint of 3.8 global hectares per person.
Which Countries’ Consumption the Lowest Footprints?
In contrast, emerging economies typically have less resource-intensive lifestyles. As a result, Bangladesh ranks #1 at 0.7 global hectares per person. Pakistan (0.7) and Myanmar (1.1) round out the top three.
Explore the Sustainable Trade Index
This infographic was just a small subset of what the Sustainable Trade Index has to offer. To learn more, visit the Hinrich Foundation, where you can download additional resources including the entire report for free.

Visit the Hinrich Foundation to download the entire report, for free.
-
 Economy4 weeks ago
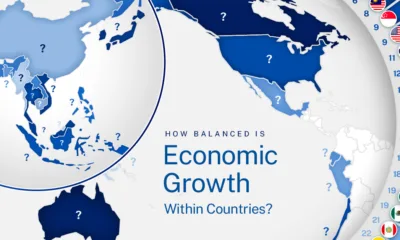
How Balanced Is Economic Growth Within Countries?
Levels of economic development differ not only from one country to another, but also dramatically within their own borders. Which countries lead versus lag?
-
 Markets3 months ago
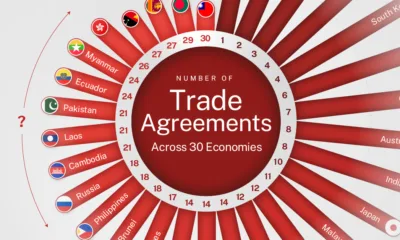
Ranked: Number of Trade Agreements Across 30 Economies
Based on data from the World Trade Organization, which countries have the highest and lowest number of trade agreements?
-
 Markets4 months ago
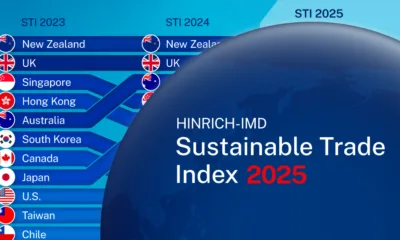
Ranked: The World’s Most Sustainable Economies in 2025
Based on the Hinrich Foundation’s 2025 Sustainable Trade Index, which economies are the most and least sustainable?
-
 Economy4 months ago
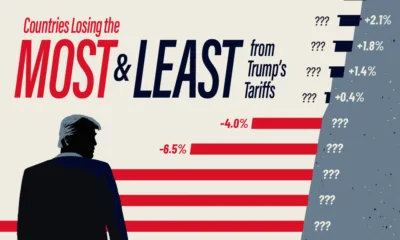
Ranked: Countries Losing the Most (and Least) from Trump’s Tariffs
Trump’s tariffs affect all major U.S. trading partners, but what matters is how each country’s tariffs compare to its competitors.
-
 Economy6 months ago
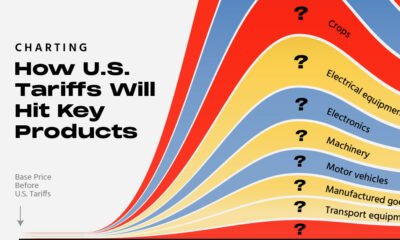
Charting How U.S. Tariffs Will Hit Key Products
U.S. tariffs have climbed to an average rate of 18.6%—the highest since 1933. But what does this mean for everyday consumers?
-
 Economy8 months ago
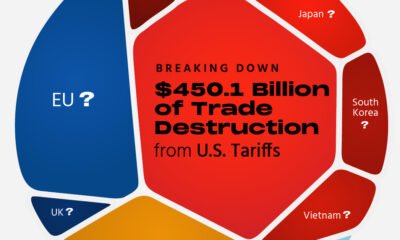
Breaking Down the $450 Billion of Trade Destruction from U.S. Tariffs
The UN has crunched the numbers projecting the ripple effects of Trump’s May 12th tariffs. Which economies are bracing for the biggest hits?
-
 Economy10 months ago
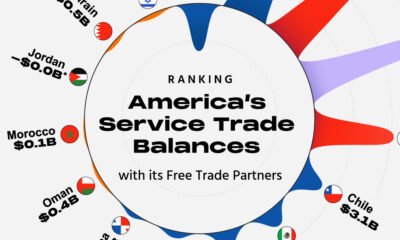
Ranked: America’s Services Trade Balances
America’s goods trade deficits have dominated headlines, but a critical part of the equation is being ignored: services trade.
-
 AI11 months ago
Visualized: All of the World’s Data
More data will be created, captured, and replicated in the next three years than in the rest of human history. But by how much?
-

 Economy12 months ago
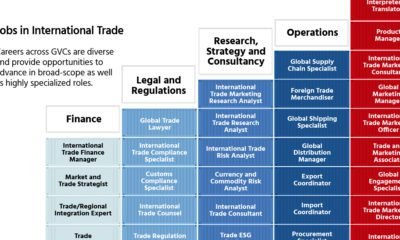
Visualized: The Growing Opportunities in Global Trade Careers
Visual Capitalist has partnered with the Hinrich Foundation to explore the landscape of global trade and find out what students and trade professionals can do to…
-
 Green12 months ago
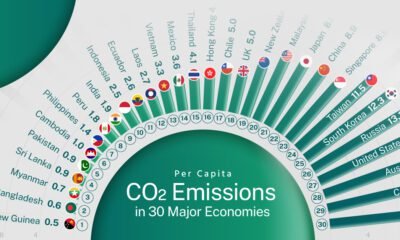
Ranked: CO₂ Emissions Per Person in 30 Economies
CO₂ emissions are reshaping the flows of international trade. Which countries have the highest and lowest CO₂ emissions per capita
-
 Healthcare1 year ago
Mapped: Life Expectancy in Major Economies
Which countries have the highest and lowest life expectancies at birth?
-
 Markets1 year ago
Ranked: Government Debt Across Major Economies
Based on data from the IMF’s World Economic Outlook, which countries have the highest and lowest government debt ratios?
-
 Markets1 year ago
Ranked: The World’s Most Sustainable Economies in 2024
Based on the Hinrich Foundation’s 2024 Sustainable Trade Index, which economies are the most and least sustainable?
-
 Oil and Gas2 years ago
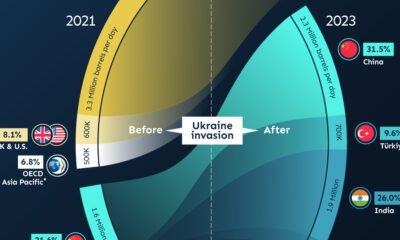
How Oil Is Adding Fuel to Geopolitical Fragmentation
Which countries and regions decreased, banned, or increased Russian oil imports following the 2022 invasion of Ukraine?
-
 Politics2 years ago
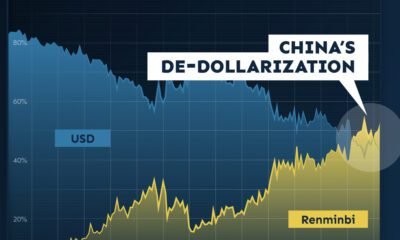
The Start of De-Dollarization: China’s Gradual Move Away from the USD
The de-dollarization of China’s trade settlements has begun. What patterns do we see in USD and RMB use within China and globally?
-
 Politics2 years ago
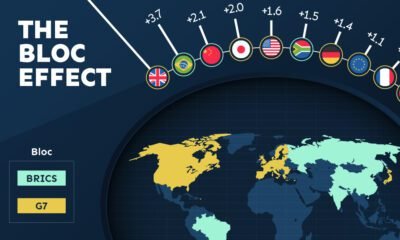
The Bloc Effect: International Trade with Geopolitical Allies on the Rise
Rising geopolitical tensions are shaping the future of international trade, but what is the effect on trading among G7 and BRICS countries?
-
 Green2 years ago
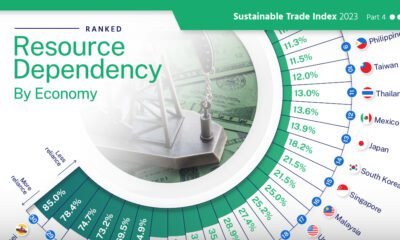
Ranked: Resource Dependency Across 30 Major Economies
High resource dependency in trade makes countries more susceptible to market fluctuations and climate change.
-
 Misc2 years ago
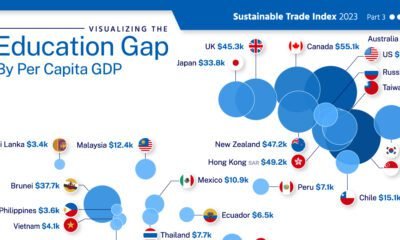
Visualizing the Global Education Gap
This graphic adds visual context to the global education gap, using data from 29 major economies.
-
 Money2 years ago
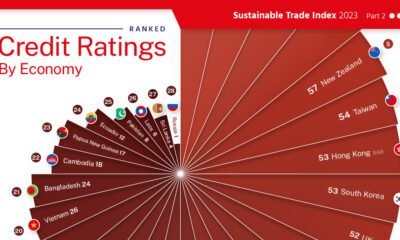
Ranking the Credit Ratings of Major Economies
This graphic visualizes 30 country’s credit ratings, using data from the 2023 Sustainable Trade Index.
-
 Economy2 years ago
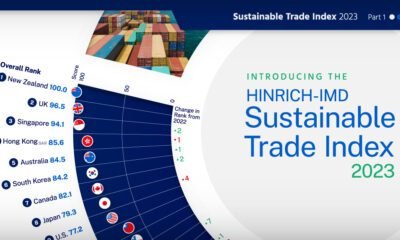
Ranked: The World’s Most Sustainable Economies in 2023
The Sustainable Trade Index 2023 is an annual ranking of the world’s most sustainable economies. View this infographic to see the results.
-
 Economy2 years ago
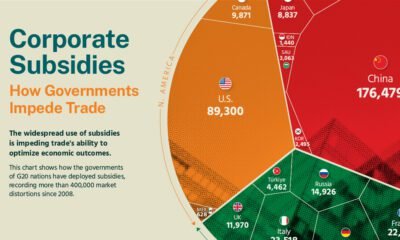
Visualizing the Impact of the G20’s Corporate Subsidies
The Hinrich Foundation visualizes the impact of corporate subsidies by G20 nations between 2008 and Q1 2023.
-
 Economy3 years ago
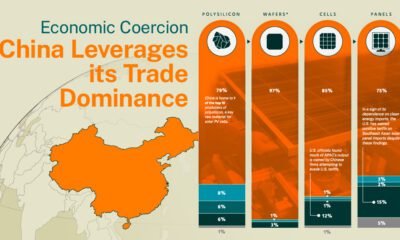
Economic Coercion: China’s Leverage in Trade
The Hinrich Foundation explores China’s use of economic coercion and the implications of its control over the solar energy sector.
-
 Politics3 years ago
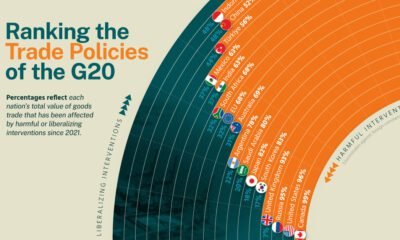
Ranking the Trade Policies of the G20
We analyze recent trade policies implemented by G20 members to determine whether they are liberalizing or harmful.
-
 Green3 years ago
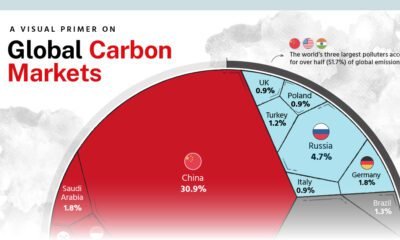
Global Carbon Markets: Highlights from the Latest Report
We highlight key findings from the Hinrich Foundation’s latest report on carbon markets, produced in partnership with Visual Capitalist.
-
 Green3 years ago
Ranked: Air Pollution by Economy
Which economies have hazy air, and which ones enjoy mostly clear skies? Find out in this geographic breakdown of air pollution levels.
-
 Politics3 years ago
Mapped: Geopolitical Risk by Economy
Prior to invading Ukraine, Russia had one of the highest levels of geopolitical risk. How does geopolitical uncertainty vary around the world?
-
 Economy3 years ago
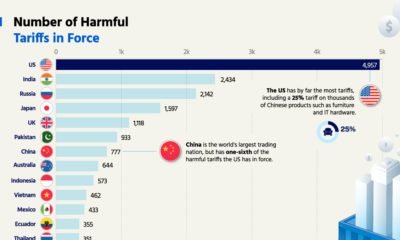
Ranked: Harmful Tariffs by Economy
The U.S. has by far the most harmful tariffs, with nearly 5,000 in force. Which economy has the least tariffs?
-
 Business3 years ago
Interested in a Career in Global Trade?
Global trade is growing across regions and countries which is creating an explosion in new jobs and education opportunities.
-
 Economy3 years ago
Introducing the 2022 Sustainable Trade Index
See which economies have the most sustainable trade policies in the Hinrich Foundation’s 2022 Sustainable Trade Index.
-
 Economy3 years ago
Global Trade Series: Fragmentation in the Digital Economy
In this infographic, we examine the current state of digital fragmentation and it’s implications on the world.
-
 Economy3 years ago
Global Trade Series: Asia’s Digital Economy
Asia’s digital economy is expanding quicker than ever, but cooperation between governments is needed to reduce barriers.
-
 Economy4 years ago
Global Trade Series: The Benefits of Free Trade
Free trade is a powerful engine for economic growth, but rising protectionism stands in the way. See what the data says in this infographic.
- Source: https://www.visualcapitalist.com/sp/hf07-which-economies-have-the-largest-ecological-footprints/


var disqus_shortname = “visualcapitalist.disqus.com”;
var disqus_title = “Which Economies Have the Largest Ecological Footprints?”;
var disqus_url = “https://www.visualcapitalist.com/sp/hf07-which-economies-have-the-largest-ecological-footprints/”;
var disqus_identifier = “visualcapitalist.disqus.com-195194”;