GDP Per Capita Growth in Major Economies (2000–2026)
See visuals like this from many other data creators on our Voronoi app. Download it for free on iOS or Android and discover incredible data-driven charts from a variety of trusted sources.
Key Takeaways
- China’s GDP per capita increased more than 10x since 2000—the fastest among major economies.
- Russia and India also saw large gains, with GDP per capita rising 811% and 589%, respectively.
- Japan is the only country where GDP per capita declined over the past 25 years.
Over the last 25 years, economic output per person has grown at very different speeds across the world’s largest economies.
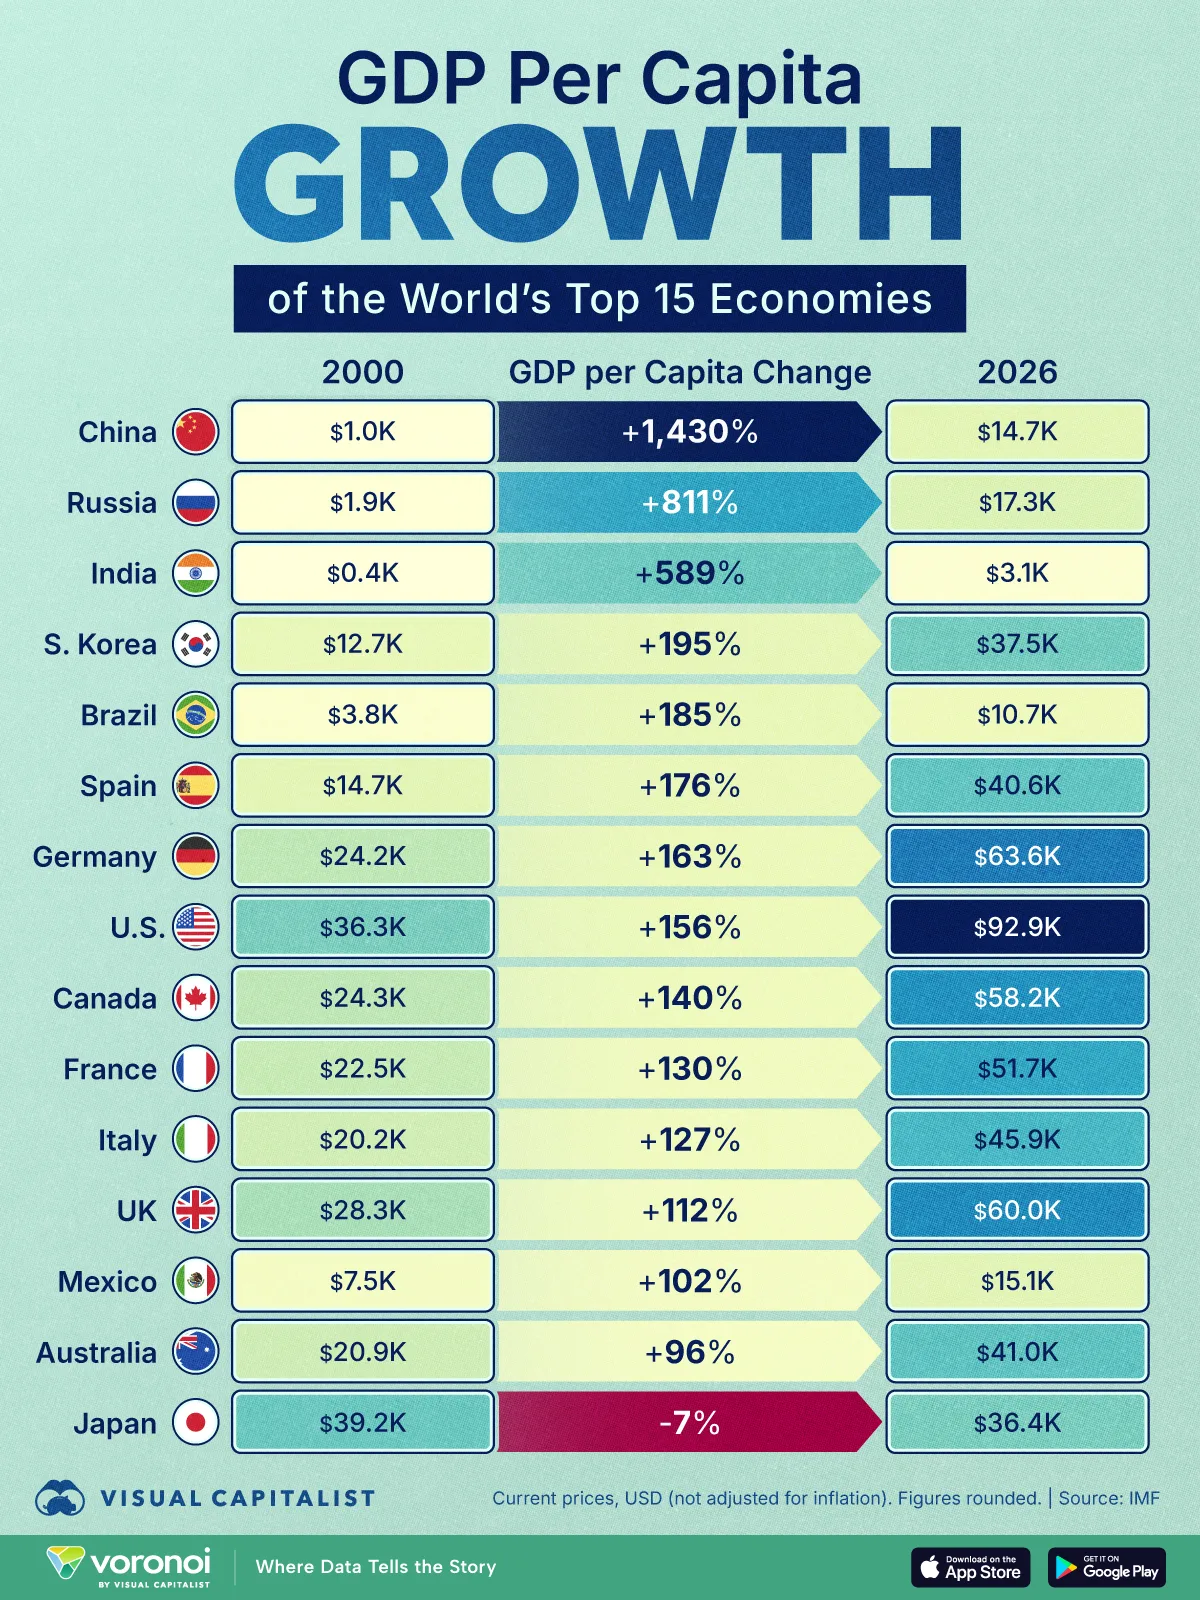
This chart ranks GDP per capita growth across 15 major economies from 2000 to 2026, based on data from the International Monetary Fund, highlighting where living standards have improved the most.
The data shows a clear divide: emerging markets like China and India recorded rapid gains in output per person, while advanced economies saw slower, more uneven growth, with Japan standing out as the only country where GDP per capita declined.
A Quarter Century of Uneven Growth
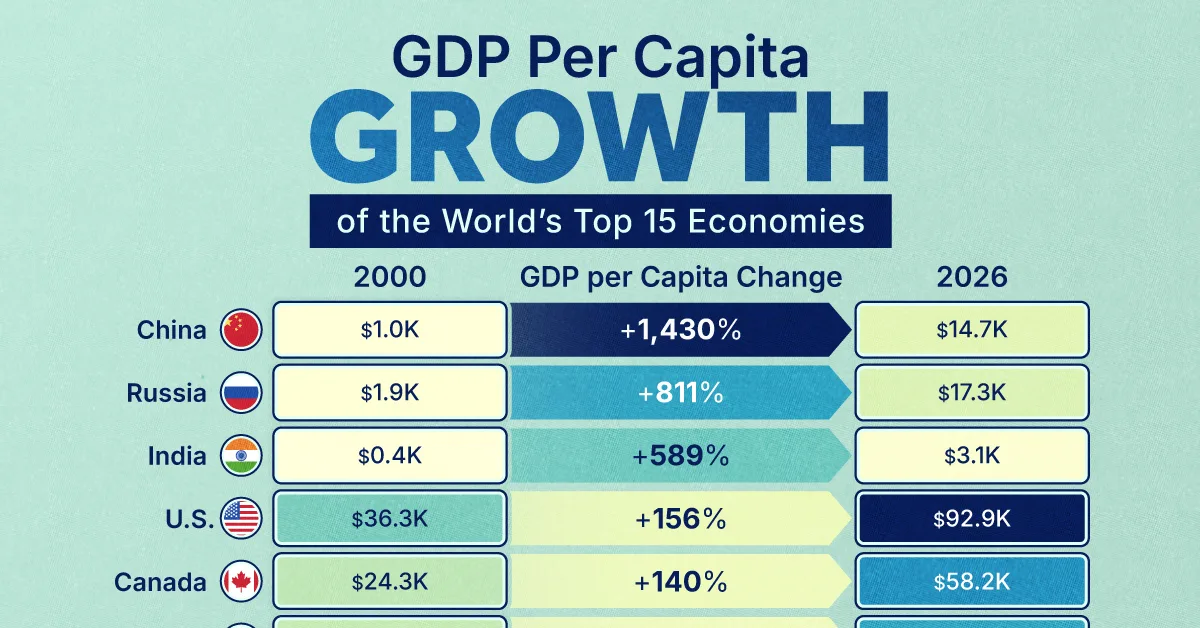
Among major economies, China leads by far, with GDP per capita rising from roughly $1.0K in 2000 to $14.7K in 2026, a 1,430% increase.
This means China added more output per person, in percentage terms, than any other major economy, fundamentally reshaping its position in the global middle class. India also recorded significant gains, with GDP per capita climbing from $0.4K to $3.1K, among the sharpest rises globally.
| Country | GDP Per Capita 2000 | GDP Per Capita 2026 | Change 2000-2026 |
|---|---|---|---|
 China China |
$1.0K | $14.7K | 1,430% |
 Russia Russia |
$1.9K | $17.3K | 811% |
 India India |
$0.4K | $3.1K | 589% |
 South Korea South Korea |
$12.7K | $37.5K | 195% |
 Brazil Brazil |
$3.8K | $10.7K | 185% |
 Spain Spain |
$14.7K | $40.6K | 176% |
 Germany Germany |
$24.2K | $63.6K | 163% |
 U.S. U.S. |
$36.3K | $92.9K | 156% |
 Canada Canada |
$24.3K | $58.2K | 140% |
 France France |
$22.5K | $51.7K | 130% |
 Italy Italy |
$20.2K | $45.9K | 127% |
 UK UK |
$28.3K | $60.0K | 112% |
 Mexico Mexico |
$7.5K | $15.1K | 102% |
 Australia Australia |
$20.9K | $41.0K | 96% |
 Japan Japan |
$39.2K | $36.4K | -7% |
Russia saw GDP per capita jump 811%, marking a robust economic turnaround following the country’s financial collapse in 1998.
Around 2000, Russia began ramping up oil production after decades of decline, driving its economic recovery. While state control of energy assets stood at around 10% in 2000, it grew to nearly 50% in less than a decade.
Meanwhile, South Korea’s GDP per capita more than tripled to reach $37.5K, owing to its manufacturing prowess. Since 2000, it has transformed from an emerging to an advanced economy, with GDP per capita now exceeding Japan’s.
Similarly, GDP per capita in Brazil grew notably, fueled by a commodity boom in the 2000s, although growth slowed in the decade that followed.
Advanced Economies See Slower Growth
While rich nations saw comparatively lower growth than developing markets, a wide gap emerged within this group.
Overall, Spain experienced the fastest growth, with GDP per capita rising 176%. In 2025, it grew at nearly twice the rate of eurozone countries, supported by domestic consumption and tourism.
Germany, meanwhile, saw GDP per capita increase 163%, even outpacing the U.S.’s gain of 156%. Yet unlike Spain, Germany has recently faced dismal growth amid weaker exports.
Japan stands alone as the only major economy where GDP per capita is lower today than in 2000. Compared to 2000, GDP per capita has contracted 7%, due to a mix of low inflation, slow population growth, and years of economic stagnation.
Learn More on the Voronoi App 
To learn more about this topic, check out this graphic on G7 vs. BRICS countries’ share of the global economy since 1980.