Our XXL Lysimeter Experiment, Article 5 of 6
A soil-CO₂ sensor is a tempting instrument. Weathering consumes CO₂, so — the reasoning goes — bury a probe, log the gas, and read carbon removal straight out of the ground. This article is about what those sensors actually gave us over four years. It is not the carbon meter the pitch promises. It is something arguably more interesting: a live window on the processes inside the soil — the breathing, the microbes, the water — and a clear view of how little our basalt treatments changed any of it.
We are well placed to look, because there is a soil-CO₂ sensor in every pot — twenty in all (Seeed Studio LoRaWAN CO₂ probes), one per pot at about 20 cm, logging daily for four years. So everything below is not one trace but twenty.
The soil breathes
The first thing the sensors show is that the soil is a CO₂ factory. Soil CO₂ ran roughly 2,000–9,000 ppm — five to twenty times the ~500 ppm of the outside air. That gas is the exhaust of the living soil: roots and microbes respiring. And it breathes with the year — high every summer, collapsing every winter.
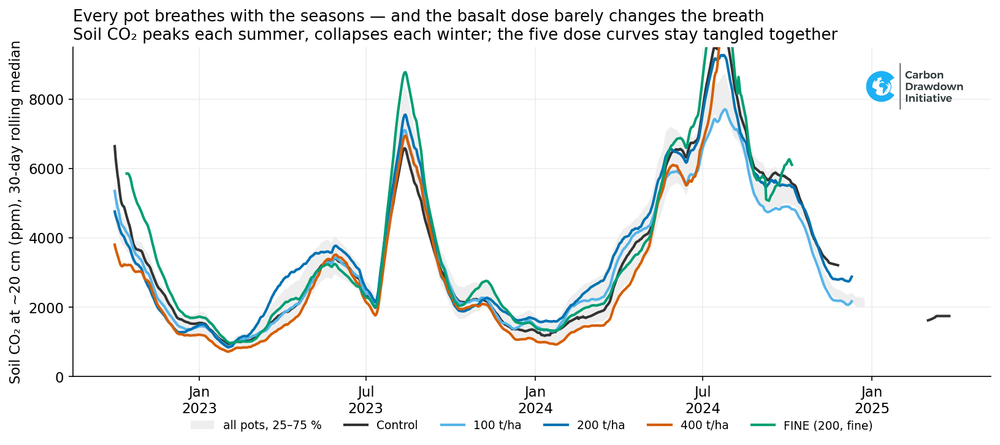
Figure 1: Soil CO₂ by dose over four years (30-day rolling median on the daily record). A strong seasonal wave — summer peaks, winter lows — repeated in every treatment. (The five dose curves stay tangled; more on that below.)
What runs the breath: warmth, then water
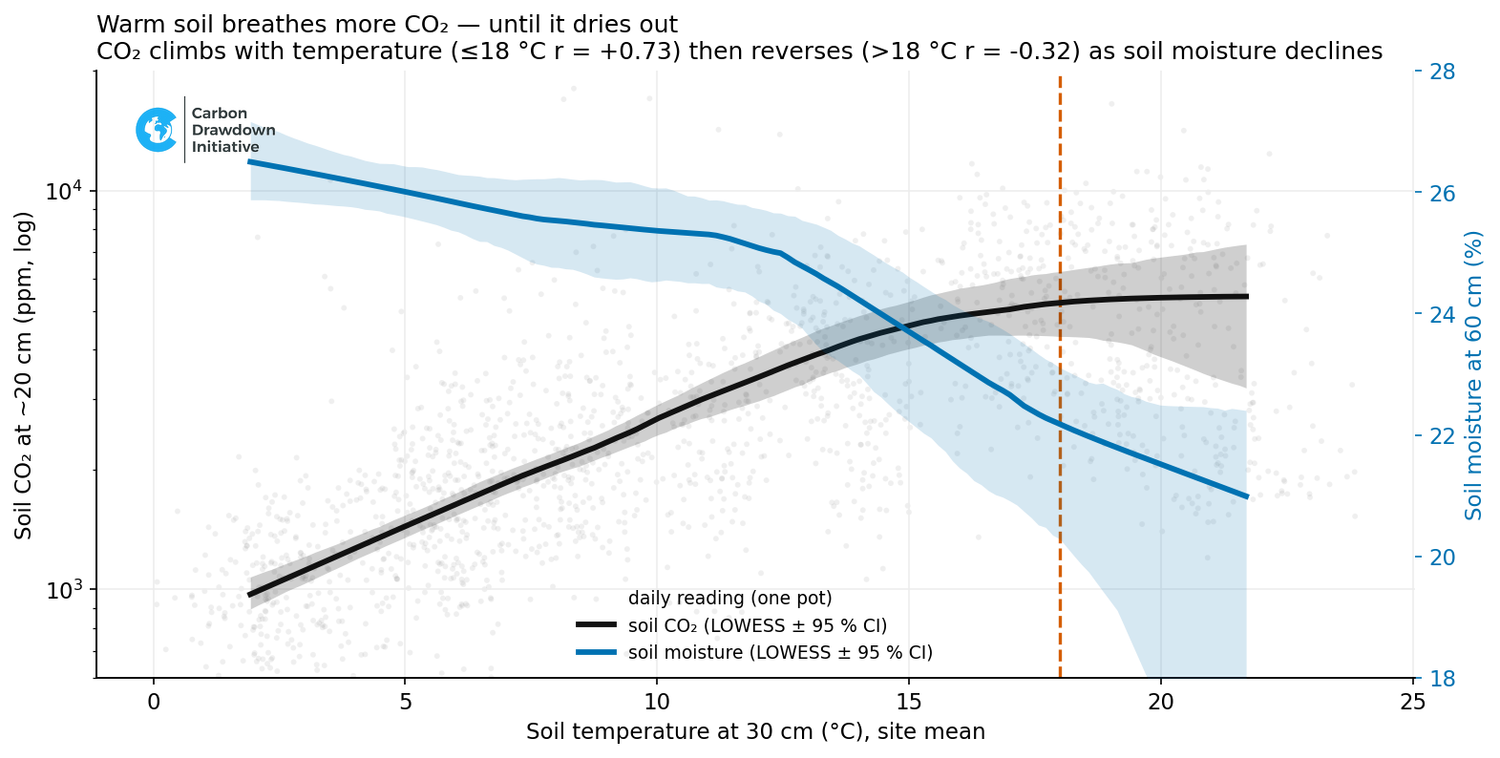
Two things govern how hard the soil breathes, and the sensors let us see both at once. Temperature is the throttle: warmer soil respires more, and soil CO₂ climbs with it — up to a point. Above about 18 °C the trend reverses. The reason is in the second line on the same plot: as the soil warms into summer it also dries, and once the water runs short the microbes slow down and the breath falls despite the heat.
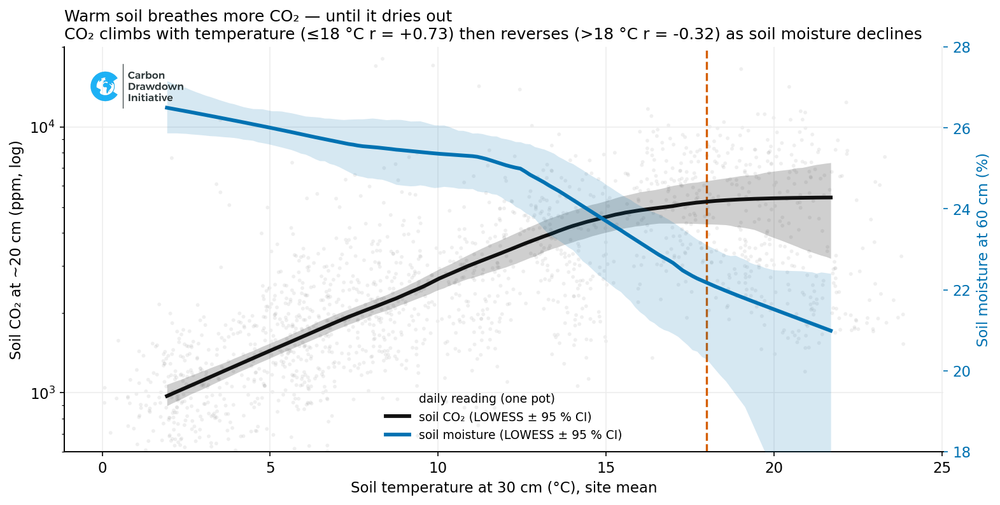
Figure 2: Soil CO₂ (black) and soil moisture (blue) against soil temperature, each a smooth trend with its 95 % confidence band; grey points are the daily readings. CO₂ climbs with temperature to ~18 °C (r = +0.73) then turns over (r = −0.32) exactly as the moisture trend slides away. On warm days it is moisture, not temperature, that sets the CO₂ (r = +0.66).
So the soil’s breath is a product of warmth and water — either one, missing, throttles it. That interaction is not an abstraction. We can watch it happen.
Rewetting wakes it up: a repeated Birch effect
When dry soil is rewetted, the dormant microbes roar back and the soil exhales a burst of CO₂ — the Birch effect. In article 2 we met it once, as the flush that followed the first big storm on our freshly built soil in August 2022. With daily CO₂ in every pot, we can now show it is not a one-off: it happens every time a dry spell breaks.
At this depth the soil dries deeply about once a year — late summer into autumn — so we found five such dry→wet transitions (2022 and 2023 in summer, 2023 and 2024 in autumn, and 2025, the driest of all — though by then nearly all the CO₂ sensors had died, so it survives only in the EC). We lined each record up at its moisture minimum and ran it to the next rewetting, so every curve is one full drought-to-drought cycle.
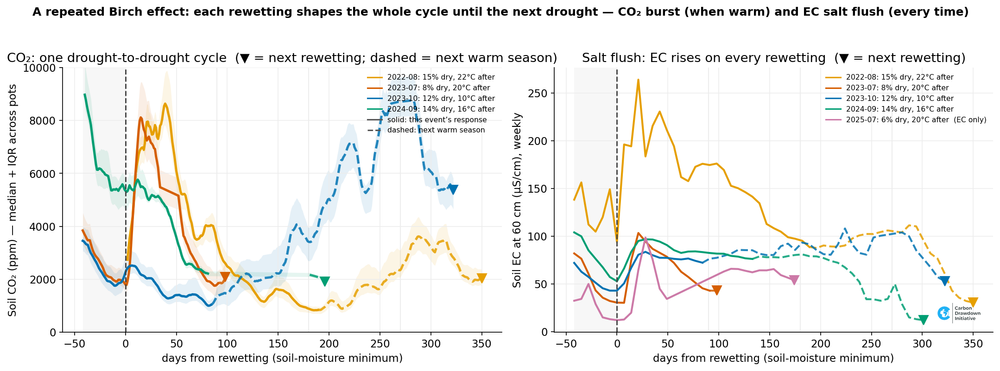
Figure 3: Soil CO₂ (left, per-pot median + IQR) and soil EC (right), aligned at each soil-moisture minimum (day 0) and run to the next rewetting (▼) — one full drought-to-drought cycle per event. Solid is the response to that rewetting (the burst, then the decay into winter); dashed is the following year’s warm season rising toward the next drought. The salt flush (EC) rises after every event, warm or cool. Labels: how dry the soil got and how warm the fortnight after.
Two signatures, behaving differently, and both instructive:
-
The respiration burst (CO₂) needs warmth. The two summer rewettings (20–22 °C after) set off large bursts — CO₂ roughly doubling to quadrupling, the 2022 storm on the raw built soil more still. The two autumn rewettings (11–16 °C) barely stir: water alone is not enough; the microbes only throw a party when it is also warm. This is the temperature × moisture interaction of Figure 2, caught as a live event.
-
The salt flush (EC) happens every time. Soil EC climbs after all five rewettings, warm or cool — including the 2025 drought that the CO₂ sensors never lived to see — because mobilising and dissolving salts is physical chemistry, not biology; it does not wait for warmth.
One pulse, two clocks. It is the clearest picture we have of the soil as a living system responding to its water supply.
The breath drives the weathering
This biology is not a sideshow to the carbon story — it is the engine of it. The CO₂ the soil breathes dissolves into the pore water as carbonic acid, and that acid is what attacks the rock. We can see the first half of that chain directly: more soil CO₂, lower leachate pH.
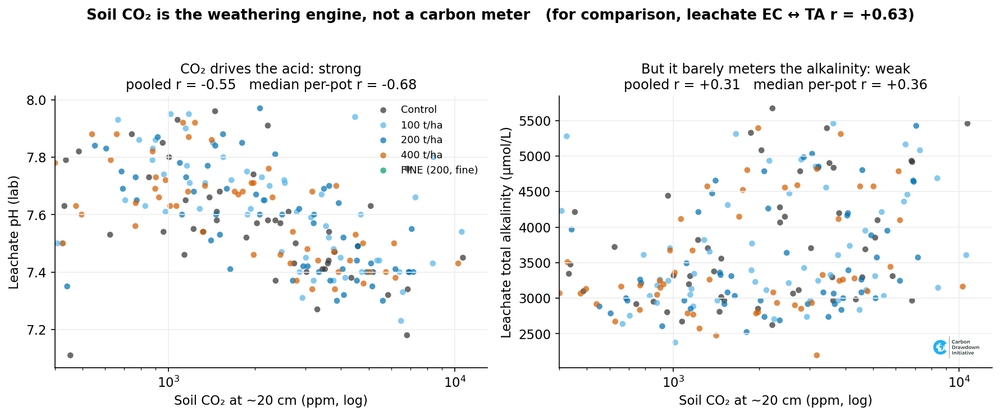
Figure 4: Soil CO₂ vs leachate pH (left) and vs leachate alkalinity (right), per pot. CO₂ drives the acid strongly (pH, median per-pot r = −0.68) but tracks the alkalinity that acid produces only weakly (TA, r = +0.36) — well below the leachate EC ↔ TA benchmark (r = +0.63).
But note the second panel, because it is the whole reason a CO₂ sensor cannot be a carbon meter. Soil CO₂ makes the acid (strong link to pH), yet it barely tracks the bicarbonate that finally leaves the pot (weak link to alkalinity). The gas is the cause at the top of the chain; how much carbon is actually exported depends on how much rock dissolves and, above all, how much water drains through to carry the ions away — and a gas sensor is blind to the water. Soil CO₂ is the engine of weathering, not the meter that counts the product.
There is a subtler trap, too. Even a clear CO₂ signal would be ambiguous. Spreading crushed rock also fertilises the soil, and well-fed microbes respire harder. That extra breath could mean more weathering (good) — or microbes burning through the soil’s own stored carbon, a CO₂ source that would eat into the removal (bad). The same reading can point either way, and the gas alone cannot tell you which. And the blind spot compounds over the years: with a burst on every rewetting (the repeated Birch effect above), those pulses could be steadily drawing down the soil’s own organic-carbon stock — and a probe in the pore space cannot see it. Only sampling the solid phase, the soil itself, would show whether that carbon is being lost; it is a gap this leachate-and-sensors series cannot close on its own.
And the basalt dose barely touches any of it
Which brings us to the treatments. With a sensor in every pot we can finally ask whether more basalt changes the soil’s breathing — and the answer is no. It should not surprise us: the leachate alkalinity and the buried EC probe (articles 2 and 4) already show no dose effect, so a CO₂ dose signal would be the anomaly.
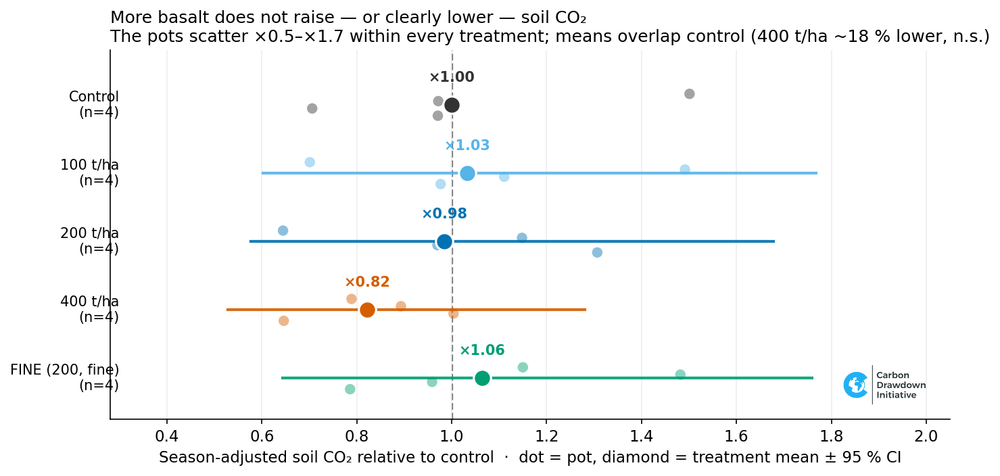
Figure 5: Season-adjusted soil CO₂ per treatment relative to control (dot = pot, diamond = mean ± 95 % CI). Every treatment overlaps control; 400 t/ha trends ~18 % lower but is not significant (p = 0.33), and the pots scatter ×0.5–×1.7 within each treatment.
The pots vary far more among themselves than the doses vary from one another. Whatever the basalt does to the soil’s biology here, it is smaller than the soil’s own pot-to-pot spread — the same verdict every other instrument returned.
What the sensors were good for
So the soil-CO₂ sensors did not measure our carbon removal. What they did was let us read the soil as a living thing: a factory breathing five-to-twenty times the outdoor air, its output set by the interplay of warmth and water, roaring back to life every time the rain returns, and quietly acidifying its own pore water — the precondition for the weathering we are after. For counting carbon, the instruments that see the alkalinity itself — the leachate, and the buried EC probe of article 4 — remain the ones to trust. A soil-CO₂ sensor is best used for what it is genuinely good at: watching the engine run.
Next, and last: four years of the plumbing behind all of this — rainfall and the water balance, ambient CO₂, and the uncomfortable arithmetic of sensor survival.
The XXL Lysimeter dataset (2022-2026) series
-
Intro article — why a 1,400-day, daily-instrumented experiment is worth the wait.
-
Dose–response — the initial flush (the Birch effect, not weathering), the long convergence, the n = 4 power problem, and the FINE-is-a-different-rock confound.
-
The soil breathes — how temperature and soil CO₂ drive a seasonal weathering engine visible in the buried sensors.
-
A buried EC sensor as a continuous MRV proxy — the 60 cm probe tracks leachate chemistry remarkably well (and the 30 cm one does not); the long-term, in-situ extension of our EC-as-alkalinity-proxy work.
-
What the soil tells us when it breathes — reading four years of buried CO₂ sensors: the soil as a living system of warmth, water and microbes — and why even a sensor in every pot is the weathering engine, not a carbon meter.
-
Four years of buried sensors — rainfall, ambient CO₂, and the reality that most field sensors die within two to three years.
References (Birch effect / drying–rewetting)
-
Birch, H.F. (1958). The effect of soil drying on humus decomposition and nitrogen availability. Plant and Soil 10(1): 9–31. https://doi.org/10.1007/BF01343734
-
Davidson, E.A., Belk, E. & Boone, R.D. (1998). Soil water content and temperature as independent or confounded factors controlling soil respiration. Global Change Biology 4(2): 217–227. https://doi.org/10.1046/j.1365-2486.1998.00128.x
-
Kim, D.-G. et al. (2012). Effects of soil rewetting and thawing on soil gas fluxes: a review. Biogeosciences 9(7): 2459–2483. https://doi.org/10.5194/bg-9-2459-2012
-
Barnard, R.L., Blazewicz, S.J. & Firestone, M.K. (2020). Rewetting of soil: revisiting the origin of soil CO₂ emissions. Soil Biology and Biochemistry 147: 107819. https://doi.org/10.1016/j.soilbio.2020.107819
-
Miller, A.E. et al. (2005). Episodic rewetting enhances carbon and nitrogen release from chaparral soils. Soil Biology and Biochemistry 37(12): 2195–2204. https://doi.org/10.1016/j.soilbio.2005.03.021
-
Liu, F. et al. (2025). Abiotic processes dominate short-term carbon emissions in sandy soils following rewetting. Communications Earth & Environment 6: 733. https://doi.org/10.1038/s43247-025-02733-z
Data, code & figures: doi.org/10.5281/zenodo.21216439 (CC-BY-4.0) · github.com/dirkpaessler/carbdown_xxl_lysimeter_2022_2026