Mapped: U.S. Population Change by State Through 2050
Key Takeaways
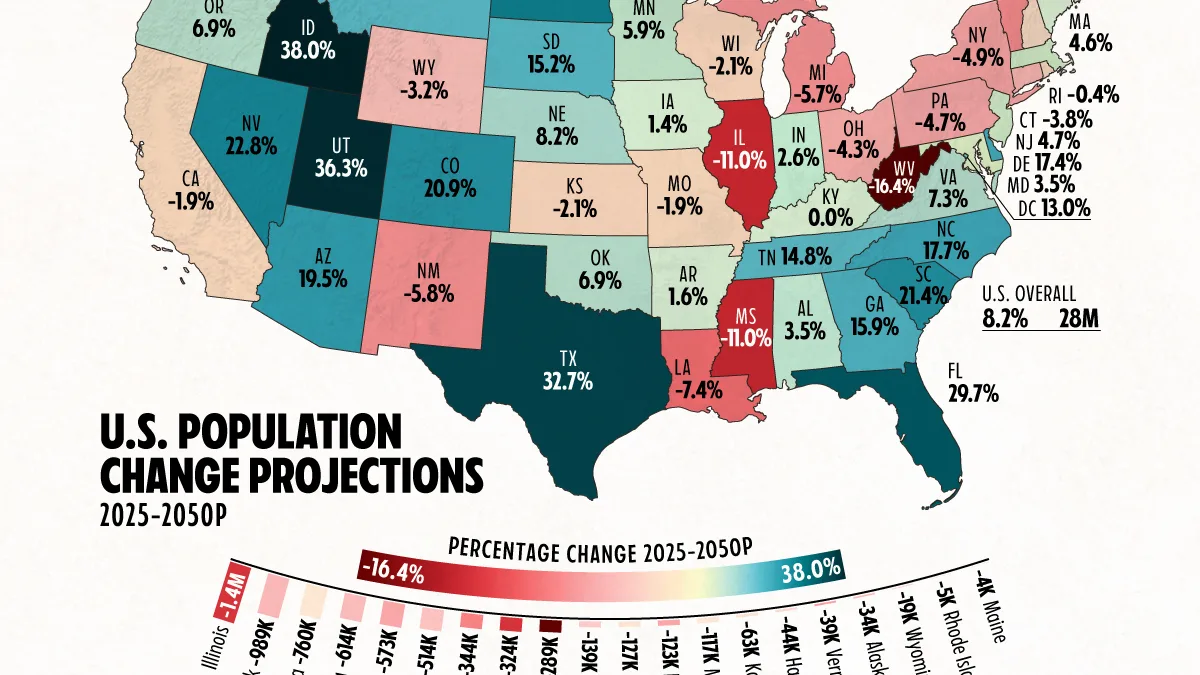
- The U.S. population is projected to increase by 28 million people, or 8.2%, between 2025 and 2050.
- Texas and Florida alone are projected to add 17.4 million residents, accounting for 62% of the nation’s population increase.
- California and New York, two of the country’s four most populous states, are projected to lose roughly 760,000 and 989,000 residents, respectively.
America’s population growth through 2050 is projected to be increasingly concentrated in the South and Mountain West, while several states are expected to lose residents.
New projections from the University of Virginia’s Weldon Cooper Center, incorporating the Census Bureau’s latest population estimates, show how the population of every state is expected to change over the next 25 years.
How Every State’s Population Is Projected to Change
The following table shows the projected percentage and numerical population change for all 50 states and Washington, D.C.
| Rank | State | Population Change 2025-2050P | % Change |
|---|---|---|---|
| 1 | Texas | 10,381,342 | 32.7% |
| 2 | Florida | 6,972,052 | 29.7% |
| 3 | North Carolina | 1,979,467 | 17.7% |
| 4 | Georgia | 1,796,269 | 15.9% |
| 5 | Washington | 1,595,347 | 19.9% |
| 6 | Arizona | 1,488,266 | 19.5% |
| 7 | Utah | 1,286,189 | 36.3% |
| 8 | Colorado | 1,258,060 | 20.9% |
| 9 | South Carolina | 1,191,727 | 21.4% |
| 10 | Tennessee | 1,079,735 | 14.8% |
| 11 | Idaho | 771,954 | 38.0% |
| 12 | Nevada | 748,582 | 22.8% |
| 13 | Virginia | 648,092 | 7.3% |
| 14 | New Jersey | 451,393 | 4.7% |
| 15 | Minnesota | 344,581 | 5.9% |
| 16 | Massachusetts | 331,157 | 4.6% |
| 17 | Oregon | 295,077 | 6.9% |
| 18 | Oklahoma | 285,768 | 6.9% |
| 19 | Maryland | 220,244 | 3.5% |
| 20 | North Dakota | 193,724 | 24.2% |
| 21 | Delaware | 184,832 | 17.4% |
| 22 | Alabama | 180,756 | 3.5% |
| 23 | Indiana | 177,922 | 2.6% |
| 24 | Montana | 170,031 | 14.9% |
| 25 | Nebraska | 166,227 | 8.2% |
| 26 | South Dakota | 141,910 | 15.2% |
| 27 | District of Columbia | 90,092 | 13.0% |
| 28 | Arkansas | 51,202 | 1.6% |
| 29 | Iowa | 44,224 | 1.4% |
| 30 | New Hampshire | 11,943 | 0.8% |
| 31 | Kentucky | 1,363 | 0.0% |
| 32 | Maine | -3,729 | -0.3% |
| 33 | Rhode Island | -4,545 | -0.4% |
| 34 | Wyoming | -18,676 | -3.2% |
| 35 | Alaska | -33,991 | -4.6% |
| 36 | Vermont | -39,400 | -6.1% |
| 37 | Hawaii | -43,574 | -3.0% |
| 38 | Kansas | -62,629 | -2.1% |
| 39 | Missouri | -116,731 | -1.9% |
| 40 | New Mexico | -123,006 | -5.8% |
| 41 | Wisconsin | -126,928 | -2.1% |
| 42 | Connecticut | -138,679 | -3.8% |
| 43 | West Virginia | -289,191 | -16.4% |
| 44 | Mississippi | -323,931 | -11.0% |
| 45 | Louisiana | -343,451 | -7.4% |
| 46 | Ohio | -513,895 | -4.3% |
| 47 | Michigan | -572,506 | -5.7% |
| 48 | Pennsylvania | -614,086 | -4.7% |
| 49 | California | -759,590 | -1.9% |
| 50 | New York | -989,152 | -4.9% |
| 51 | Illinois | -1,402,122 | -11.0% |
| — |  U.S. Total U.S. Total |
28,019,716 | 8.2% |
Population gains are concentrated among a relatively small group of states, with the largest increases centered in the South and West.
Texas leads by absolute growth, adding a projected 10.4 million people, followed by Florida at nearly 7 million. North Carolina ranks third with an increase of about 2 million.
The picture changes when looking at percentage growth. Idaho, which was also among the fastest-growing states from 2020 to 2025, leads the projections at 38.0%, followed by Utah at 36.3%. At the opposite end, West Virginia is projected to decline by 16.4%, the steepest drop nationally.
How the Population Outlook Has Changed
The latest projections differ significantly from the Cooper Center’s previous vintage. The 2026 update incorporates the Census Bureau’s 2025 Population Estimates, reflecting more recent demographic trends.
The revisions are particularly striking for California and New York. California shifted from a projected gain of 3.1 million residents to a decline of about 760,000, while New York moved from a projected gain of 820,000 to a loss of nearly one million.
Meanwhile, projected gains increased for Texas from 8.6 million to 10.4 million and for Florida from 5.2 million to 7 million.
America’s Population Center Keeps Moving South
By 2050, the South is projected to contain 42.7% of the U.S. population, up from 38.1% in 2020. Meanwhile, the Northeast and Midwest are expected to account for smaller shares of the national population.
This shift is already visible in recent Census data. From 2024 to 2025, Texas added 391,000 residents, more than any other state, followed by Florida and North Carolina.
Learn More on the Voronoi App
To learn more about this topic, check out this graphic showing where wealth is moving in America.