How Countries Compare on Tax Revenue
Key Takeaways
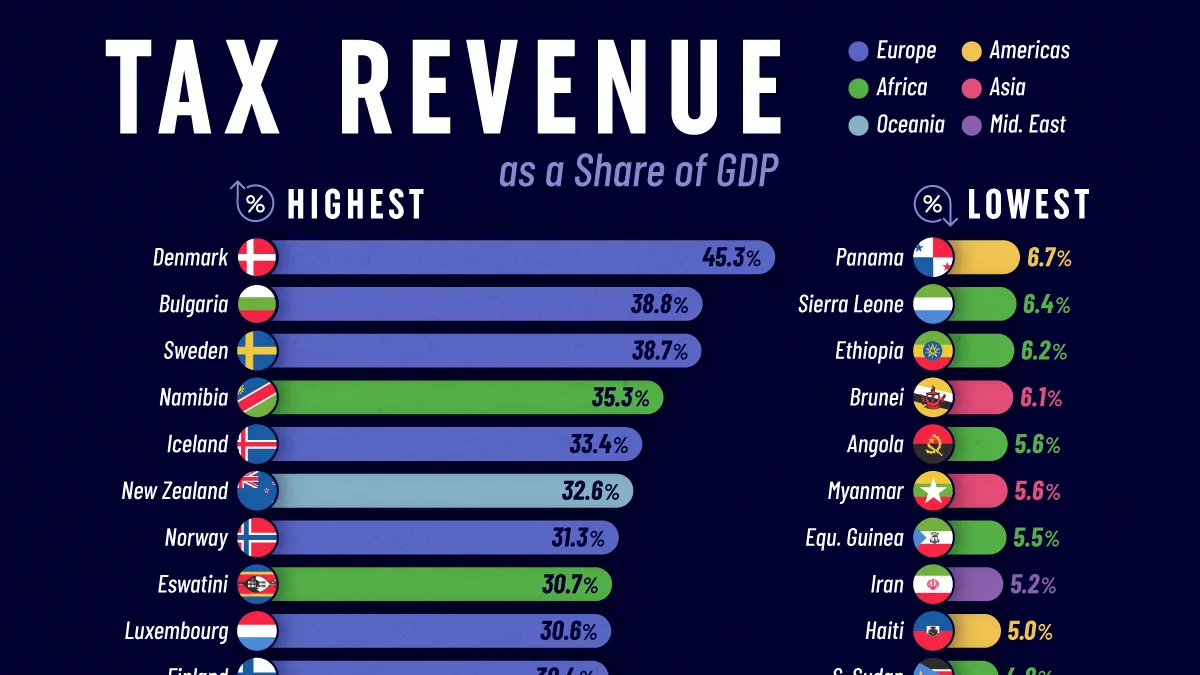
- Denmark collects tax revenue equal to 45.3% of GDP, the highest globally, and more than twice the 19.5% collected in the U.S.
- Seven of the 10 countries with the highest tax-revenue shares are in Europe.
- Several oil-rich economies rank near the bottom, where resource revenues can reduce reliance on conventional taxes.
Tax revenue varies dramatically around the world, reflecting differences in tax systems, economic development, and other sources of government income.
Using the latest data from the International Monetary Fund (IMF), this graphic compares tax revenue as a share of GDP across countries in 2024.
Compare your country with its peers in the final table on this page.
Where Governments Rely Most on Taxes
Among wealthy economies, the differences are substantial. Denmark collects tax revenue equal to 45.3% of GDP, versus roughly 29% in Canada and Australia and just 19.5% in the United States.
| Rank | Country | Tax Revenue as % of GDP (2024) |
|---|---|---|
| 1 |  Denmark Denmark |
45.3% |
| 2 |  Bulgaria Bulgaria |
38.8% |
| 3 |  Sweden Sweden |
38.7% |
| 4 |  Namibia Namibia |
35.3% |
| 5 |  Iceland Iceland |
33.4% |
| 6 |  New Zealand New Zealand |
32.6% |
| 7 |  Norway Norway |
31.3% |
| 8 |  Eswatini Eswatini |
30.7% |
| 9 |  Luxembourg Luxembourg |
30.7% |
| 10 |  Finland Finland |
30.4% |
| 11 |  Italy Italy |
29.6% |
| 12 |  Belgium Belgium |
29.6% |
| 13 |  Canada Canada |
29.5% |
| 14 |  Australia Australia |
29.4% |
| 15 |  Montenegro Montenegro |
29.0% |
| 16 |  France France |
28.7% |
| 17 |  UK UK |
28.5% |
| 18 |  Austria Austria |
28.3% |
| 19 |  Greece Greece |
27.8% |
| 20 |  Barbados Barbados |
27.8% |
These differences partly reflect how countries structure their tax systems and fund public services.
Nordic countries generally have broad tax bases that help finance extensive public programs, while the U.S. relies more heavily on private spending in areas such as healthcare and retirement.
The World’s Least Taxed Countries
At the other end of the ranking, oil-rich economies sit alongside some of the world’s poorest countries. Both collect relatively little in taxes, but for very different reasons.
| Rank | Country | Tax Revenue as a % of GDP (2024) |
|---|---|---|
| 1 |  Libya Libya |
1.2% |
| 2 |  Kuwait Kuwait |
1.4% |
| 3 |  Iraq Iraq |
1.7% |
| 4 |  Yemen Yemen |
2.0% |
| 5 |  Sudan Sudan |
2.0% |
| 6 |  Somalia Somalia |
2.2% |
| 7 |  Nigeria Nigeria |
3.4% |
| 8 |  Qatar Qatar |
3.8% |
| 9 |  Bahrain Bahrain |
4.4% |
| 10 |  Oman Oman |
4.5% |
| 11 |  South Sudan South Sudan |
4.8% |
| 12 |  Haiti Haiti |
5.0% |
| 13 |  Iran Iran |
5.2% |
| 14 |  Equatorial Guinea Equatorial Guinea |
5.5% |
| 15 |  Angola Angola |
5.6% |
| 16 |  Myanmar Myanmar |
5.6% |
| 17 |  Brunei Brunei |
6.1% |
| 18 |  Ethiopia Ethiopia |
6.2% |
| 19 |  Sierra Leone Sierra Leone |
6.4% |
| 20 |  Panama Panama |
6.7% |
For major oil producers, natural resources provide an alternative source of government revenue. Kuwait collects just 1.4% of GDP in taxes, while Qatar, Bahrain, and Oman are all below 5%.
In lower-income countries, low tax collections can instead reflect large informal economies and limited tax-collection capacity. Similar tax levels can therefore result from resource wealth in one country and difficulty raising revenue in another.
America’s Growing Tax and Spending Gap
The U.S. occupies an interesting position in the global comparison. Its tax take is lower than that of many other advanced economies, while federal spending is projected to remain substantially higher than federal revenues.
In 2026, federal spending is projected at 23.3% of GDP, versus revenues of 17.5%. By 2036, those figures are projected to reach 24.4% and 17.8%, respectively. Meanwhile, net interest is projected to more than double to $2.1 trillion, nearly matching all federal discretionary spending.
This leaves a persistent gap between what the federal government collects and what it spends, while a growing share of the budget goes toward servicing past borrowing.
Tax Revenue Around the World
Countries’ tax revenues vary based on development levels, institutional capacity, tax systems, and resource wealth. The table below lists countries worldwide by tax revenue as a percentage of GDP in 2024.
| Country | Tax Revenue as % of GDP (2024) |
|---|---|
 Afghanistan Afghanistan |
10.9% |
 Albania Albania |
19.8% |
 Algeria Algeria |
9.4% |
 Andorra Andorra |
15.8% |
| Angola |
5.6% |
 Antigua and Barbuda Antigua and Barbuda |
15.6% |
 Argentina Argentina |
22.8% |
 Armenia Armenia |
22.4% |
 Aruba Aruba |
21.0% |
| Australia |
29.4% |
| Austria |
28.3% |
 Azerbaijan Azerbaijan |
17.8% |
| Bahrain |
4.4% |
 Bangladesh Bangladesh |
7.4% |
| Barbados |
27.8% |
 Belarus Belarus |
27.2% |
| Belgium |
29.6% |
 Belize Belize |
23.2% |
 Benin Benin |
13.2% |
 Bhutan Bhutan |
10.8% |
 Bolivia Bolivia |
17.8% |
 Bosnia and Herzegovina Bosnia and Herzegovina |
22.6% |
 Botswana Botswana |
22.4% |
 Brazil Brazil |
25.6% |
| Brunei Darussalam |
6.1% |
| Bulgaria |
38.8% |
 Burkina Faso Burkina Faso |
18.8% |
 Burundi Burundi |
12.1% |
 Cabo Verde Cabo Verde |
19.4% |
 Cambodia Cambodia |
12.5% |
 Cameroon Cameroon |
12.7% |
| Canada |
29.5% |
 Central African Republic Central African Republic |
7.8% |
 Chad Chad |
7.4% |
 Chile Chile |
19.6% |
 China China |
13.0% |
 Colombia Colombia |
23.0% |
 Comoros Comoros |
8.9% |
 Costa Rica Costa Rica |
13.2% |
 Cote d’Ivoire Cote d’Ivoire |
13.6% |
 Croatia Croatia |
27.2% |
 Cyprus Cyprus |
25.3% |
 Czech Republic Czech Republic |
18.9% |
 DR Congo DR Congo |
9.8% |
| Denmark |
45.3% |
 Djibouti Djibouti |
11.0% |
 Dominica Dominica |
22.3% |
 Dominican Republic Dominican Republic |
14.5% |
 Ecuador Ecuador |
13.6% |
 Egypt Egypt |
11.7% |
 El Salvador El Salvador |
21.6% |
| Equatorial Guinea |
5.5% |
 Estonia Estonia |
22.9% |
| Eswatini |
30.7% |
| Ethiopia |
6.2% |
 Fiji Fiji |
22.3% |
| Finland |
30.4% |
| France |
28.7% |
 Gabon Gabon |
13.3% |
 Georgia Georgia |
24.9% |
 Germany Germany |
23.0% |
 Ghana Ghana |
13.3% |
| Greece |
27.8% |
 Grenada Grenada |
23.6% |
 Guatemala Guatemala |
11.8% |
 Guinea Guinea |
12.3% |
 Guinea-Bissau Guinea-Bissau |
8.8% |
 Guyana Guyana |
8.2% |
| Haiti |
5.0% |
 Honduras Honduras |
17.5% |
 Hong Kong SAR Hong Kong SAR |
14.2% |
 Hungary Hungary |
24.7% |
| Iceland |
33.4% |
 India India |
18.1% |
 Indonesia Indonesia |
10.1% |
| Iran |
5.2% |
| Iraq |
1.7% |
 Ireland Ireland |
20.5% |
 Israel Israel |
24.9% |
| Italy |
29.6% |
 Jamaica Jamaica |
25.6% |
 Japan Japan |
20.2% |
 Jordan Jordan |
15.4% |
 Kazakhstan Kazakhstan |
16.0% |
 Kenya Kenya |
12.9% |
 Kiribati Kiribati |
17.5% |
 Korea Korea |
13.2% |
 Kosovo Kosovo |
27.1% |
| Kuwait |
1.4% |
 Kyrgyz Republic Kyrgyz Republic |
21.8% |
 Lao P.D.R Lao P.D.R |
12.4% |
 Latvia Latvia |
22.8% |
 Lebanon Lebanon |
10.3% |
 Lesotho Lesotho |
23.5% |
 Liberia Liberia |
11.6% |
| Libya |
1.2% |
 Liechenstein Liechenstein |
14.5% |
 Lithuania Lithuania |
22.3% |
| Luxembourg |
30.7% |
 Macao SAR Macao SAR |
25.9% |
 Madagascar Madagascar |
11.4% |
 Malawi Malawi |
14.1% |
 Malaysia Malaysia |
12.5% |
 Maldives Maldives |
24.3% |
 Mali Mali |
15.8% |
 Malta Malta |
23.1% |
 Marshall Islands Marshall Islands |
13.9% |
 Mauritania Mauritania |
15.3% |
 Mauritius Mauritius |
23.1% |
 Mexico Mexico |
15.7% |
 Micronesia Micronesia |
16.5% |
 Moldova Moldova |
21.2% |
 Mongolia Mongolia |
23.9% |
| Montenegro |
29.0% |
 Morocco Morocco |
20.8% |
 Mozambique Mozambique |
20.3% |
| Myanmar |
5.6% |
| Namibia |
35.3% |
 Nauru Nauru |
19.4% |
 Nepal Nepal |
16.4% |
 Netherlands Netherlands |
26.5% |
| New Zealand |
32.6% |
 Nicaragua Nicaragua |
20.9% |
 Niger Niger |
6.9% |
| Nigeria |
3.4% |
 North Macedonia North Macedonia |
18.9% |
| Norway |
31.3% |
| Oman |
4.5% |
 Pakistan Pakistan |
9.9% |
 Palau Palau |
21.7% |
| Panama |
6.7% |
 Papua New Guinea Papua New Guinea |
12.1% |
 Paraguay Paraguay |
11.4% |
 Peru Peru |
14.3% |
 Philippines Philippines |
15.4% |
 Poland Poland |
22.2% |
 Portugal Portugal |
24.9% |
| Qatar |
3.8% |
 Republic of Congo Republic of Congo |
10.6% |
 Romania Romania |
16.4% |
 Russia Russia |
19.2% |
 Rwanda Rwanda |
13.8% |
 Samoa Samoa |
24.1% |
 San Marino San Marino |
17.6% |
 Sao Tome and Principe Sao Tome and Principe |
10.8% |
 Saudi Arabia Saudi Arabia |
7.2% |
 Senegal Senegal |
18.2% |
 Serbia Serbia |
23.5% |
 Seychelles Seychelles |
27.4% |
| Sierra Leone |
6.4% |
 Singapore Singapore |
14.3% |
 Slovak Republic Slovak Republic |
19.6% |
 Slovenia Slovenia |
21.5% |
 Solomon Islands Solomon Islands |
21.4% |
| Somalia |
2.2% |
 South Africa South Africa |
25.2% |
| South Sudan |
4.8% |
 Spain Spain |
23.9% |
 Sri Lanka Sri Lanka |
12.4% |
 St. Kitts and Nevis St. Kitts and Nevis |
15.2% |
 St. Lucia St. Lucia |
19.7% |
 St. Vincent and the Grenadines St. Vincent and the Grenadines |
23.6% |
| Sudan |
2.0% |
 Suriname Suriname |
18.9% |
| Sweden |
38.7% |
 Switzerland Switzerland |
20.0% |
 Tajikistan Tajikistan |
17.1% |
 Tanzania Tanzania |
11.9% |
 Thailand Thailand |
16.0% |
 The Bahamas The Bahamas |
17.3% |
 The Gambia The Gambia |
11.1% |
 Timor-Leste Timor-Leste |
9.1% |
 Togo Togo |
14.9% |
 Tonga Tonga |
22.0% |
 Trinidad and Tobago Trinidad and Tobago |
21.9% |
 Tunisia Tunisia |
25.3% |
 Turkmenistan Turkmenistan |
11.9% |
 Tuvalu Tuvalu |
17.0% |
 Türkiye Türkiye |
16.6% |
 UAE UAE |
18.2% |
 Uganda Uganda |
12.9% |
 Ukraine Ukraine |
27.4% |
| United Kingdom |
28.5% |
 United States United States |
19.5% |
 Uruguay Uruguay |
18.2% |
 Uzbekistan Uzbekistan |
13.6% |
 Vanuatu Vanuatu |
13.9% |
 Vietnam Vietnam |
13.0% |
 West Bank and Gaza West Bank and Gaza |
25.6% |
| Yemen |
2.0% |
 Zambia Zambia |
17.3% |
 Zimbabwe Zimbabwe |
11.6% |
Learn More on the Voronoi App
To learn more about this topic, check out this graphic breaking down income tax revenue by wealth bracket in America.