Which U.S. Cities Are the Healthiest in 2026?
Key Takeaways
- San Francisco ranks as America’s healthiest city in 2026, followed by San Diego and Seattle.
- Western cities claim eight of the top 10 spots, with California accounting for seven of the top 25.
- New York City ranks just 23rd, behind cities including Pittsburgh, Minneapolis, and Atlanta.
How much does your ZIP code influence your health? From access to doctors and fresh food to parks and fitness facilities, where you live can make staying healthy easier or harder.
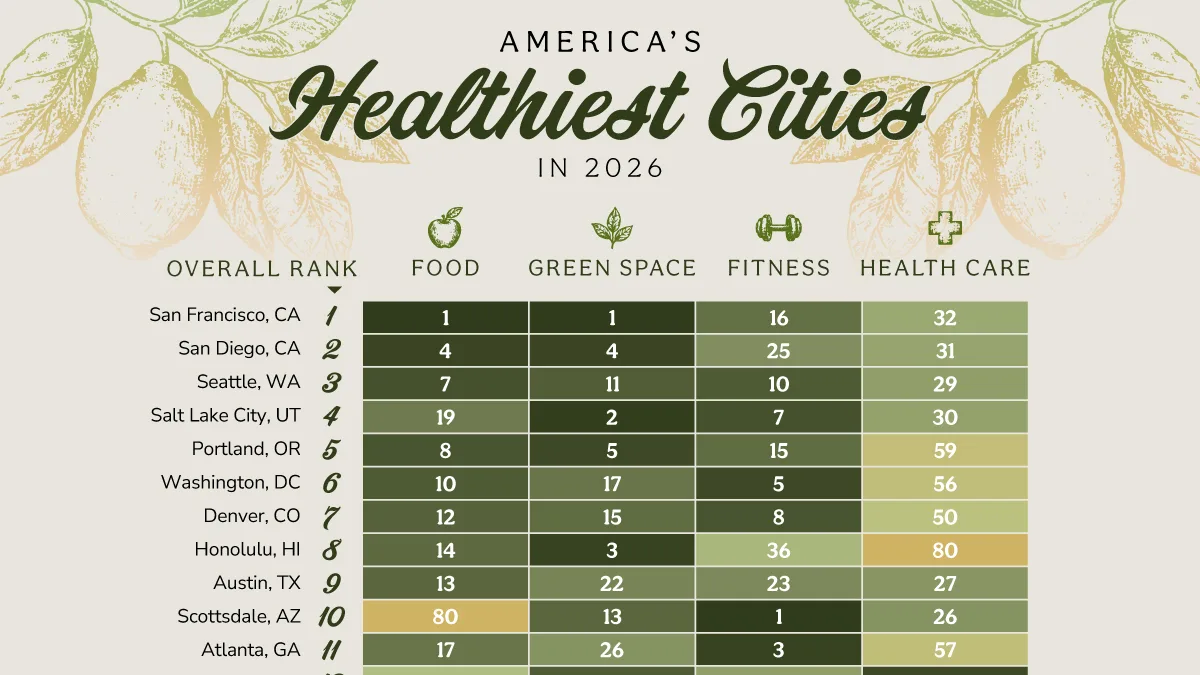
This graphic ranks America’s healthiest cities in 2026, based on WalletHub’s analysis of 182 U.S. cities across 41 indicators. The study evaluates health care, food, fitness, and green space, combining access to healthy living resources with selected health behaviors and outcomes.
What Makes America’s Healthiest Cities Different?
San Francisco tops the list, ranking first for both healthy food and green space. It also has the nation’s second-lowest adult obesity rate, at roughly 18%.
San Diego follows in second, ranking fourth for both healthy food and green space. The city also has the sixth-most hiking trails per capita. Meanwhile, Seattle takes third, with 87% of adults reporting physical activity in the past month, among the highest rates nationwide.
| Overall Rank | City | Food | Green Space | Fitness | Health Care |
|---|---|---|---|---|---|
| 1 | San Francisco, CA | 1 | 1 | 16 | 32 |
| 2 | San Diego, CA | 4 | 4 | 25 | 31 |
| 3 | Seattle, WA | 7 | 11 | 10 | 29 |
| 4 | Salt Lake City, UT | 19 | 2 | 7 | 30 |
| 5 | Portland, OR | 8 | 5 | 15 | 59 |
| 6 | Washington, DC | 10 | 17 | 5 | 56 |
| 7 | Denver, CO | 12 | 15 | 8 | 50 |
| 8 | Honolulu, HI | 14 | 3 | 36 | 80 |
| 9 | Austin, TX | 13 | 22 | 23 | 27 |
| 10 | Scottsdale, AZ | 80 | 13 | 1 | 26 |
| 11 | Atlanta, GA | 17 | 26 | 3 | 57 |
| 12 | Irvine, CA | 38 | 10 | 29 | 5 |
| 13 | Minneapolis, MN | 28 | 12 | 37 | 10 |
| 14 | Pittsburgh, PA | 18 | 33 | 44 | 17 |
| 15 | Los Angeles, CA | 5 | 18 | 53 | 92 |
| 16 | Oakland, CA | 3 | 36 | 55 | 54 |
| 17 | Boston, MA | 11 | 45 | 70 | 8 |
| 18 | San Jose, CA | 9 | 40 | 72 | 11 |
| 19 | Fremont, CA | 20 | 69 | 17 | 7 |
| 20 | Chicago, IL | 16 | 25 | 20 | 91 |
| 21 | Huntington Beach, CA | 41 | 30 | 9 | 20 |
| 22 | Portland, ME | 21 | 6 | 118 | 13 |
| 23 | New York, NY | 2 | 21 | 97 | 111 |
| 24 | Orlando, FL | 25 | 58 | 24 | 39 |
| 25 | Raleigh, NC | 36 | 107 | 2 | 15 |
New York City presents a notable contrast. Despite ranking second for healthy food, it places just 23rd overall, with much lower rankings for health care (111th) and fitness (97th).
Why Health Care Doesn’t Tell the Whole Story
None of America’s 10 healthiest cities ranks among the top 25 for health care. Instead, the leading cities tend to perform better in categories that shape daily habits, including healthy food, fitness, and green space.
Columbia, Maryland, illustrates this contrast. Despite ranking first for health care, it places just 34th overall, with much lower rankings for food (89th) and green space (95th).
Meanwhile, Scottsdale, Arizona, ranks first for fitness and 10th overall, despite placing 80th for healthy food. These examples show how different combinations of strengths can produce a high overall ranking.
The Hidden Value of Urban Parks
Access to parks is a recurring advantage among America’s healthiest cities. San Francisco, Seattle, Portland, and Washington, D.C., all rank among the nation’s top 10 park systems.
In San Francisco, every resident lives within a 10-minute walk of a park. Nationwide, however, more than 100 million Americans, including 28 million children, live beyond that distance.
Parks also generate economic returns. Research across major U.S. cities estimates that every $1 invested in parks and recreation yields at least $3 in annual local economic benefits, on average. These include lower health care and stormwater management costs, alongside higher municipal tax revenues.
Together, these findings highlight the value of well-designed cities, where access to parks and other amenities can support healthier daily routines while benefiting the wider community.
Learn More on the Voronoi App
To learn more about this topic, check out this graphic on the salary needed to live comfortably in U.S. cities.