https://grist.org/
25 Years on the Climate Beat
Fri, 18 Apr 2025 23:25:11 +0000
en-US
hourly
1
https://wordpress.org/?v=6.7.2
https://grist.org/wp-content/uploads/2021/03/cropped-Grist-Favicon.png?quality=75&strip=all&w=32
https://grist.org/
32
32
184496365
https://grist.org/politics/right-to-repair-ohio-missouri-texas-red-states-republican-conservative/
Fri, 18 Apr 2025 08:45:00 +0000
https://grist.org/?p=663510
<
Christian Charisius / picture alliance via Getty Images
Blessing gladly acknowledges the environmental benefits of expanded repair access, but it isn’t the main reason the issue matters to him. He describes himself as “a very free-market guy” who doesn’t like the idea of big businesses being allowed to monopolize markets. He’s concerned that’s exactly what has happened in the electronics repair space, where it is common for manufacturers to restrict access to spare parts and repair manuals, steering consumers back to them to get their gadgets fixed — or, if the manufacturer doesn’t offer a particular repair, replaced.
“It’s good for a business to be able to monopolize repair,” Blessing said. “But it is most certainly not pro-free market. It’s not pro-competition.”
Blessing is now sponsoring a right-to-repair bill, called the Digital Fair Repair Act, for the third legislative session in a row. While earlier iterations of the bill never made it out of committee, he feels optimistic about the legislation’s prospects this year, in light of growing support for the right to repair across civil society and the business community. In the past, manufacturers like Apple and Microsoft have vehemently lobbied against right-to-repair bills, but these and other corporations are changing their tune as the movement gains steam.
“I think there’s an appetite to get something done,” Blessing told Grist, adding that more and more device manufacturers “want to see something that puts this to rest.”
Repair monopolies don’t just restrict market competition. They also limit a person’s freedom to do what they want with their property. That’s the reason Brian Seitz, a Republican state congressman representing Taney County in southwestern Missouri, is sponsoring a motorcycle right-to-repair bill for the third time this year.
Seitz first grew interested in the right to repair about four years ago, when a group of motorcyclists in his district told him they weren’t able to fix their bikes because they were unable to access necessary diagnostic codes. A spokesperson for the American Motorcyclist Association confirmed to Grist that lack of access to repair-relevant data is “a concern for our membership.” Some manufacturers are moving away from on-board diagnostic ports where owners can plug in and access the information they need to make fixes, the spokesperson said.

AP Photo / David A. Lieb
“The person who drives a motorcycle is a certain type of individual,” Seitz said. “They’re free spirits. They love the open road. And they brought to my attention that they weren’t allowed to repair their vehicles. And I couldn’t believe it.”
It’s still early days for Seitz’s bill, which has been referred to the Missouri House Economic Development Committee but does not have a hearing scheduled yet. But a version of the bill passed the House during the last legislative session, and Seitz expects it will pass again.
“Whether or not there’s time to get it done in the Senate, that’s yet to be determined,” he said. The bill died in the Missouri Senate during the last legislative session.
A spokesperson for Missouri Governor Mike Kehoe declined to comment on Seitz’s bill. But if it were to pass both chambers and receive Kehoe’s signature this year, it would be the first motorcycle-specific right-to-repair law in the country. (A 2014 agreement establishing a nationwide right-to-repair in the auto industry explicitly excluded motorcycles.) Seitz believes many of his fellow conservatives would be “very much in favor” of that outcome.
“This is a freedom and liberty issue,” Seitz added.
Personal liberty is also at the heart of a recent white paper on the right to repair by the Texas Public Policy Foundation, or TPPF, an influential conservative think tank. The paper lays out the legal case for Texas to adopt a comprehensive right-to-repair law “to restore control, agency, and property rights for Texans.” Since publishing the paper, TPPF staffers have advocated for the right to repair in op-eds and closed-door meetings with state policymakers.
“Our interest in the right to repair is rooted in a concrete fundamental belief in the absolute nature of property rights and how property rights are somewhat skirted by corporations who restrict the right to repair,” Greyson Gee, a technology policy analyst with the TPPF who co-authored the white paper, told Grist.
In February, Giovanni Capriglione, a Republican member of the Texas House of Representatives and the chairman of the state legislature’s Innovation and Technology Caucus, introduced an electronics right-to-repair bill that the TPPF provided input on. In March, Senator Bob Hall introduced a companion bill in the Senate.

Jonas Walzberg / picture alliance via Getty Images
Early drafts of these bills include some carve-outs that repair advocates have criticized elsewhere, including an exemption for electronics used exclusively by businesses or the government, and a stipulation that manufacturers do not need to release circuit boards on the theory that they could be used to counterfeit devices. The Texas bills also contain an “alternative relief” provision that allows manufacturers to reimburse consumers, or offer them a replacement device, instead of providing repair materials. (Ohio’s bill, by contrast, mandates that manufacturers provide board-level components necessary to effect repairs, and it does not allow them to offer refunds instead of complying.)
Gee says the TPPF has been working with repair advocacy organizations and the bill sponsor to strengthen the bill’s language and is “encouraged by the real possibility of establishing a statutory right to repair in Texas.”
“Chairman Capriglione is one of the strongest pro-consumer advocates in the Texas House, and we will continue to work with his office as this bill advances [to] ensure there is a codified right to repair in the state,” Gee added. Capriglione, who represents part of the Fort Worth area, didn’t respond to Grist’s request for comment.
Elsewhere around the country, lawmakers across the political spectrum are advancing other right-to-repair bills this year. In Washington state, a bill covering consumer electronics and household appliances passed the state House in March by a near-unanimous vote of 94 to 1, underscoring the breadth of bipartisan support for independent repair. In April, the Senate passed its version of the bill 48 to 1. The House must now vote to concur with changes that were made in the Senate, after which the bill heads to the governor’s desk.
“This legislation has always been bipartisan,” Democratic state representative Mia Gregerson, who sponsored the bill, told Grist. “The ability to fix our devices that have already been paid for is something we can all get behind.” In her five years working on right-to-repair bills in the state, Gregerson said, she has negotiated with Microsoft, Google, and environmental groups to attempt to address consumer and business needs while reducing electronic waste.
Conservative politicians and pundits also acknowledge the environmental benefits of the right to repair, despite focusing on personal liberty and the economy in their messaging. In its white paper arguing for a right-to-repair law in Texas, the TPPF highlights the potential for such legislation to eliminate e-waste, citing United Nations research that ties the rapid growth of this trash stream to limited repair and recycling options.
“Ultimately, the bill itself has to be constitutional. It has to be up to snuff legally,” Gee said. “But it’s certainly an advantage, the environmental impact that this bill would have.”
Blessing, from Ohio, agreed. Right to repair will “absolutely mean less electronics in our landfills, among other things,” he told Grist. “I don’t want to diminish that at all.”
This story was originally published by Grist with the headline The environmental policy backed by free-market Republicans on Apr 18, 2025.
]]>
6635109
Despite focusing on personal liberty and the economy in their messaging, conservative politicians and pundits also acknowledge the environmental benefits of the right to repair. In its white paper arguing for a right-to-repair law in Texas, the Texas Public Policy Foundation highlights the potential for such legislation to eliminate e-waste, citing United Nations research that ties the rapid growth of this trash stream to limited repair and recycling options.]]>
https://grist.org/food-and-agriculture/milk-school-lunch-plant-based-vegan-whole-dairy-lobby-congress/
Fri, 18 Apr 2025 08:30:00 +0000
https://grist.org/?p=663531
<
Ben Hasty / MediaNews Group / Reading Eagle via Getty Images
Milk has a relatively low carbon footprint compared to other animal proteins, like beef, pork, poultry, and cheese. But dairy production still comes with considerable climate impacts — mainly from the food grown to feed cows, as well as methane emitted via cow burps and manure. In 2020, researchers at Pennsylvania State University found that a dairy cow can release 350 pounds of methane every year through their burps — meaning, all told, dairy cows are responsible for 2.7 percent of the U.S.’s total greenhouse gases.
Nondairy milks — fortified drinks like soy, almond, oat, and rice milk — have varying impacts on the environment and climate, but all of these plant-based alternatives use less land and water than cow’s milk to produce, and result in fewer emissions.
Under the NSLP, schools cannot be reimbursed for the cost of meals unless they offer students milk. The Center for a Humane Economy, an animal welfare and environmental group backing the FISCAL Act, calls this America’s “milk mandate.” In 2023, student Marielle Williamson sued her Los Angeles high school for not allowing her to set up an informational table about plant-based milk unless she also promoted dairy. Subsidized school lunches have been described as “a guaranteed market” for farmers’ products; this is all but acknowledged when legislators like Thompson blame school lunch for the decline of the dairy industry. Indeed, in a recent Senate agricultural committee hearing over the whole milk bill, Senator Amy Klobuchar, a Democrat, said, “Not only do school meal programs reduce hunger and promote learning, they also support our local farmers and ranchers at a time when it’s probably the very worst time I’ve seen in decades” for farmers.
The animal welfare groups backing the FISCAL Act argue schools need more flexibility to meet the needs of students with lactose intolerance. Consumption of milk has fallen consistently since the 1970s, according to the U.S. Department of Agriculture’s Economic Research Service. That change is thought to be the result of shifting diets, as well as perhaps a reflection of America’s growing racial and ethnic diversity. It is estimated that half of American adults have difficulty digesting lactose, the protein found in milk and many other dairy products. These rates are higher in Black, Asian American, Hispanic, Native American, and Jewish communities.
“We’ve had so much marketing to tell us that the milk of a cow is, you know, nature’s perfect food, and it clearly is not,” said Wayne Pacelle, the head of Animal Wellness Action, an advocacy group that opposes animal cruelty and supports the FISCAL Act.
Pacelle acknowledged the climate impact of the dairy industry: “It’s just a truth that cows are big contributors to greenhouse gas emissions.” But he noted that arguments related to the climate are unlikely to sway the debate over school lunch beverages. “The Republican Congress is not really so attuned to that,” he said.
Tom Williams / CQ-Roll Call, Inc via Getty Images
As a result, his group and the others pushing for the FISCAL Act aren’t talking much about the environmental considerations of drinking cow’s milk. This aligns with a shift happening in the broader food industry under the second Trump administration, as producers and manufacturers figure out which talking points are most appealing to leaders like Health and Human Services Secretary Robert F. Kennedy, Jr., who has called for schools to start offering whole milk again.
The Republicans pushing for whole milk in schools are talking up the health and economic benefits of whole milk, an argument that came into sharp relief during a Senate agricultural committee hearing in early April. Senator Roger Marshall of Kansas, who drank from a tall glass of milk before addressing the committee, referenced the term “Make America Healthy Again,” or MAHA, when making his case. The movement, popularized by Robert F. Kennedy Jr., taps into wellness, environmental, and food safety concerns in the general public and offers solutions based in pseudoscience and conspiracy theories. Marshall, a co-sponsor of the whole milk bill in the Senate, said MAHA is “about whole foods, and I think we could categorize whole milk as part of” that framework.
While Republicans and Democrats alike may be sidestepping the dairy industry’s environmental impact and spending more time talking about student health, there is one environmental consideration that’s caught the attention of advocates of both whole milk and plant-based milk. That’s food waste, a leading source of greenhouse gas emissions. Forty-five percent of the milk cartons offered at breakfast in schools are thrown out annually because students don’t take them. When students do grab milk at breakfast, a fourth of those cartons still wind up unopened in the trash.
Krista Byler, a food service director for the Union City Area School District in northwestern Pennsylvania, spoke at the Senate agricultural committee hearing and said serving whole milk in her schools helped milk consumption go up, ultimately reducing the amount of milk wasted.
“I hated seeing such an exorbitant amount of milk wasted daily in our small district and was hearing stories of even bigger waste ratios in larger districts,” Byler said in her written testimony.
A similar case has been made by Pacelle and other supporters of the FISCAL Act, who argue students will be more likely to drink — and finish — their beverage at school if they have the option to go plant-based.
Recently, the Whole Milk for Healthy Kids bill passed a House agriculture committee vote. If it passes a full House vote, it could then move on to the Senate. Meanwhile, the FISCAL Act is still in committee in both houses of Congress.
Pacelle said the best chance the FISCAL Act has of passing is if its provisions are included as an amendment to the whole milk bill — framing it not as a rival measure, but as a complementary effort to create more choice for students. “Moving it independently is unlikely because of the power of the dairy lobby,” said Pacelle, “and the G.T. Thompsons of the world.”
toolTips(‘.classtoolTips3′,’Carbon dioxide, methane, nitrous oxide, and other gases that prevent heat from escaping Earth’s atmosphere. Together, they act as a blanket to keep the planet at a liveable temperature in what is known as the “greenhouse effect.” Too many of these gases, however, can cause excessive warming, disrupting fragile climates and ecosystems.’); toolTips(‘.classtoolTips6′,’A powerful greenhouse gas that accounts for about 11% of global emissions, methane is the primary component of natural gas and is emitted into the atmosphere by landfills, oil and natural gas systems, agricultural activities, coal mining, and wastewater treatment, among other pathways. Over a 20-year period, it is roughly 84 times more potent than carbon dioxide at trapping heat in the atmosphere.‘);
This story was originally published by Grist with the headline Whole, skim, or soy? The congressional battle over milk in school lunches. on Apr 18, 2025.
]]>
6635318
Representative Glenn “G.T.” Thompson has been on a mission to change that. The Republican legislator representing Pennsylvania’s 15th congressional district believes the 2010 law sparked a decline in students drinking milk across the board. Between 2019 and 2023, Thompson introduced the Whole Milk for Healthy Kids Act — a bill that would allow schools to serve whole milk again under the NSLP — three times without success. In January of this year, he reintroduced the bill once again — and inspired a group of animal welfare, environmental, and public health organizations to push for a vegan countermeasure.]]>
https://grist.org/economics/how-baby-chickens-became-americas-hottest-commodity/
Fri, 18 Apr 2025 08:15:00 +0000
https://grist.org/?p=663398
<![CDATA[
Murdoch’s Ranch & Home Supply in Helena, Montana, doesn’t often see a crowd. But, these days, the line to get in the door can be hours long. People have yelled at one another as they jockey for position and, inside, employees field as many 200 calls a day from eager patrons. Everyone is after the same thing: baby chickens.
“It’s pretty ridiculous,” said Kira Amdahl, who works there. Chicks typically spend days, if not weeks, at the store before finding a home. “Now people are coming in and [we are] selling out within an hour.”
Murdoch’s isn’t the only place turning people away. Nationwide, the demand for chickens has far outstripped supply, leaving would-be poulterers scrambling to find baby birds. But, experts say, the chick crunch is not directly linked to the avian influenza — also known as bird flu — that’s plagued the country. For the most part, the number of chicks on offer to hobby farmers hasn’t dipped.
“It’s not necessarily a chick shortage as there is increased demand,” said Tom Watkins, the president and co-owner of Murray McMurray Hatchery in Webster City, Iowa. Where he usually sees a two- or three-week wait for chickens, he’s sold out for the rest of the year. “I went into last fall thinking we’d have a slowdown. By the end of January, I knew it was going to be one of those different years.”
Why? Because the bird flu outbreak has raised the price of eggs. According to Federal Reserve Economic Data, a dozen eggs cost $3.37 in October. They crossed the $5 mark in January, and last month the price was up to $6.23. As costs have ratcheted up, so too has the appeal of raising layers at home. A Reddit post about the run on chicks has hundreds of upvotes, while other folks are getting around the problem by trying to hatch their own birds at home.
“Every time we have a downturn in the economy, people turn to self-sufficiency,” said Scott Beyer, an assistant professor and poultry expert at Kansas State University. Such was the case during the Great Recession, and again during the pandemic. This time it’s egg prices, and Beyer said it could take months, if not years, for commercial flocks to recover enough to stabilize the market. But, he said, that recovery will happen, and an overcorrection could even mean that “soon they’ll be discounted.”
Such swings worry Amdahl. Her store sells chicks for about 11 weeks every spring, and it is going through almost a dozen birds per customer. Last time she saws a boon like this, during COVID, it was only a few months before customers started posting flyers and Craigslist ads looking to rehome their rapidly growing chickens. Some birds got abandoned, or killed.
“It’s just sad,” said Amdahl, explaining that many people don’t realize what it takes to raise chickens. While their food might be affordable, the startup costs can be significant — from coops and shavings to feeders and potentially vet bills. Then winter comes, and there’s insulation, heat lamps, and warming strips to keep water from freezing. “It’s a lot of work.”
When done right, however, Beyer says that raising chickens can be economical and environmentally friendly. “Eggs from home are one of the easiest ways to grow protein for your plate,” he said. “We need more people to have experience with growing food and keeping animals.”
The one curveball currently, Beyer said, is the price of the chicks, which have spiked along with the surge in interest. That could make the payback period unrealistically long. But Watkins says he’s seen the demand start to ease and “at some point you will serve all the people who will keep chickens.”
For now, though, the race for chicks continues.
“We’ve been maintaining 2,000 phone calls a day for the last couple months,” said Watkins, of a volume that is at least triple what it usually is. “The demand is hard to keep up with.”
This story was originally published by Grist with the headline How baby chickens became America’s hottest commodity on Apr 18, 2025.
]]>
6633984
https://grist.org/food-and-agriculture/the-king-of-poisons-arsenic-is-building-up-in-rice/
Thu, 17 Apr 2025 08:45:00 +0000
https://grist.org/?p=662882
<
Arsenic comes in many different forms. Notoriously toxic, inorganic arsenic — compounds of the element that don’t contain carbon — is what the World Health Organization classifies as a “confirmed carcinogen” and “the most significant chemical contaminant in drinking water globally.” Such forms of arsenic are typically more toxic to humans because they are less stable than their organic counterparts and may allow arsenic to interact with molecules that ramp up exposure. Chronic exposure has been linked to lung, bladder, and skin cancers, as well as heart disease, diabetes, adverse pregnancy, neurodevelopmental issues, and weakened immune systems, among other health impacts.
Scientists and public-health specialists have known for years that the presence of arsenic in food is a mounting threat, but dietary exposure has long been considered much less of a risk in comparison to contaminated groundwater. So policy measures to mitigate the risk have been slow going. The few existing standards that have been enacted by the European Union and China, for example, are considered inconsistent and largely unenforced. No country has formally established regulations for organic arsenic exposure in foods. (In the U.S., the Food and Drug Administration has established an action level of 100 parts per billion of inorganic arsenic in infant rice cereal, but that recommendation for manufacturers isn’t an enforceable regulation on arsenic in rice or any other food.)
Wang hopes to see this change. The levels of inorganic arsenic commonly found in rice today fall within China’s recommended standards, for example, but her paper shows that lifetime bladder and lung cancer incidences are likely to increase “proportionally” to exposure by 2050. Under a “worst case” climate scenario, where global temperatures rise above 2 degrees Celsius (3.6 degrees Fahrenheit) and are coupled with CO2 levels that increase another 200 parts per million, the levels of inorganic arsenic in the rice varieties studied are projected to surge by a whopping 44 percent. That means that more than half the rice samples would exceed China’s current proposed limit, which limits 200 parts per billion for inorganic arsenic in paddy rice, with an estimated 13.4 million cancers linked to rice-based arsenic exposure.
Because these health risks are in part calculated based on body weight, infants and young children will face the biggest health burdens. Babies, in particular, may end up facing outsize risks through the consumption of rice cereals, according to the researchers.
“You’re talking about a crop staple that feeds billions of people, and when you consider that more carbon dioxide and warmer temperatures can significantly influence the amount of arsenic in that staple, the amount of health consequences related to that are, for lack of a better word, enormous,” said study coauthor Lewis Ziska, a plant biologist researching climate change and public health at Columbia University.
But everyone should not suddenly stop eating rice as a result, he added. Though the team found the amount of inorganic arsenic in rice is higher than a lot of other plants, it’s still quite low overall. The key variable is how much rice a person eats. If you are among the bulk of the world that consumes rice multiple times a week, this looming health burden could apply to you, but if you do so more sporadically, Ziska says, the inorganic arsenic you may end up exposed to won’t be “a big deal.”
In that way, the study’s projections may also deepen existing global and social inequities, as a big reason rice has long reigned as one of the planet’s most devoured grains is because it’s also among the most affordable.
Beyond mitigating global greenhouse gas emissions — what Ziska calls “waving my rainbows, unicorns, and sprinkles wand” — adaptation efforts to avoid a future with toxic rice include rice paddy farmers planting earlier in the season to avoid seeds developing under warmer temperatures, better soil management, and plant breeding to minimize rice’s propensity to accumulate so much arsenic.
Water-saving irrigation techniques such as alternate wetting and drying, where paddy fields are first flooded and then allowed to dry in a cycle, could also be used to reduce these increasing health risks and the grain’s enormous methane footprint. On a global scale, rice production accounts for roughly 8 percent of all methane emissions from human activity — flooded paddy fields are ideal conditions for methane-emitting bacteria.
“This is an area that I know is not sexy, that doesn’t have the same vibe as the end of the world, rising sea levels, category 10 storms,” said Ziska. “But I will tell you quite honestly that it will have the greatest effect in terms of humanity, because we all eat.”
toolTips(‘.classtoolTips6′,’A powerful greenhouse gas that accounts for about 11% of global emissions, methane is the primary component of natural gas and is emitted into the atmosphere by landfills, oil and natural gas systems, agricultural activities, coal mining, and wastewater treatment, among other pathways. Over a 20-year period, it is roughly 84 times more potent than carbon dioxide at trapping heat in the atmosphere.‘);
This story was originally published by Grist with the headline The ‘king of poisons’ is building up in rice on Apr 17, 2025.
]]>
6628828
https://grist.org/equity/in-louisianas-cancer-alley-where-black-communities-get-all-of-the-pollution-few-of-the-jobs/
Thu, 17 Apr 2025 08:30:00 +0000
https://grist.org/?p=663393
<
“We recognize the importance of examining equity in employment, however, this study offers an incomplete and misleading portrayal of our industry and its contributions,” David Cresson, president and CEO of the Louisiana Chemical Association, said in a statement.
Cresson pointed to several industry-supported workforce development programs, scholarships, and science camps aimed at “closing the training gap in Louisiana.”
But the study indicates education and training levels aren’t at the root of underrepresentation among states or metro areas. Louisiana’s education gap was modest, with college attainment at 30 percent for white residents and 20 percent for people of color. In places like Lake Charles and St. John the Baptist Parish, where petrochemical jobs are common, the gap was minimal — five percentage points or less.
The industry’s investments in education are “just public relations spin,” Banner said.
“The amount of money they’re investing in schools and various programs pales in comparison to how much they’re profiting in our communities,” she said. “We sacrifice so much and get so little in return.”
Louisiana is also getting little from generous tax breaks aimed at boosting employment, the study found.
The state’s Industrial Tax Exemption Program has granted 80 percent to 100 percent property tax exemptions to companies that promise to create new jobs. For each job created in Cameron Parish, where large natural gas ports have been built in recent years, companies were exempted from almost $590,000 in local taxes. In St. John, each job equated to about $1 million in uncollected tax revenue.
“This tradeoff of pollution in exchange for jobs was never an equal trade,” said Gianna St. Julien, one of the study’s authors. “But this deal is even worse when the overwhelming majority of these companies’ property taxes are not being poured back into these struggling communities.”
This story was originally published by Grist with the headline In Louisiana’s ‘Cancer Alley,’ Black communities get all of the pollution, few of the jobs on Apr 17, 2025.
]]>
6633934
https://grist.org/climate/hurricane-season-forecast-doge-slashes-noaa-jobs/
Thu, 17 Apr 2025 08:15:00 +0000
https://grist.org/?p=663334
<![CDATA[
With towns and cities in the southeastern United States still reeling from hurricanes that hit last year, scientists are now releasing their forecasts for what could unfold in the hurricane season that starts in less than two months. Colorado State University is predicting nine hurricanes in 2025, four of which could spin up into major strength, while AccuWeather is forecasting up to 10. Both are predicting an above-average season similar to last year’s, which produced monster storms like Helene. That hurricane inundated swaths of the U.S., killing 249 people and causing $79 billion in damage across seven states.
The Trump administration’s slashing of jobs at the National Oceanic and Atmospheric Administration, then, is coming at a dangerous time, experts say, as the agency generates a stream of data essential to creating hurricane forecasting models. Elon Musk’s Department of Government Efficiency, or DOGE, has eliminated hundreds of positions at NOAA as part of Musk’s stated aim of cutting $1 trillion from the federal budget. Last week, news broke that the administration was proposing to cut NOAA’s overall budget by 25 percent, with plans to eliminate funding for the agency’s research arm.
NOAA and its various divisions, like the National Weather Service and the National Hurricane Center, are the ones collecting and processing the data that weather apps like AccuWeather use for their daily forecasts. Hurricane forecasters also rely on data coming from a range of government-owned instruments: real-time measurements of ocean temperatures from a network of buoys and satellites and wind speeds from weather balloons. Those readings help scientists predict what the conditions leading up to hurricane season might say about the number of storms that could arrive this summer and their potential intensity.
All those NOAA instruments require people to maintain them and others to process the data. Though Klotzbach says he hasn’t had any issues accessing the data when running his seasonal forecast model, scientists like him are worried that losing those agency staffers to cost-cutting efforts will disrupt the stream of information just as hurricane season is getting going. The National Weather Service is already reducing its number of weather balloon launches. And on Wednesday, the New York Times reported that due to severe shortages of meteorologists and other employees, the National Weather Service is preparing for fewer forecast updates. (The National Weather Service and the National Hurricane Center did not return requests to comment for this story.)
The seasonal forecasts coming out now help to raise awareness in hurricane hotspots like the Gulf Coast, said Xubin Zeng, director of the Climate Dynamics and Hydrometeorology Center at the University of Arizona. But as the start of hurricane season approaches on June 1 and NOAA loses staff, researchers are worried that their shorter-term forecasts — the ones that alert the public to immediate dangers — could suffer, a result that would endanger American lives.
“Now we are nervous if those data will be provided — and will be provided on time — from NOAA,” Zeng said. “We are thinking about what kind of backup plans we need to have for our early-June prediction.”
To make their predictions, researchers are looking in particular at three main ingredients that hurricanes need to grow large and strong: a hot ocean that acts as fuel, high humidity, and low vertical wind shear — basically, a lack of winds that would normally break up a storm.
Getting that full picture is critical because hurricanes churn the ocean. Their winds push away the top layer of water, and deeper water rushes up to fill the void. If deeper water is colder, it can mix upward to cool the surface waters, removing the fuel that hurricanes feed on. By contrast, warmer waters from the deep might mix toward the surface, providing more storm fuel. Forecasters are predicting an above-average season this year because the Atlantic is already several degrees Fahrenheit warmer than usual.
Buoys provide a snapshot of this dynamic, measuring ocean temperatures, both for the conditions that give rise to hurricanes and the conditions that sustain them. “The buoys are critical for getting not only what’s going on with the ocean surface, but what’s going on deeper down in the ocean,” said Phil Klotzbach, a senior research scientist who oversees Colorado State University’s seasonal hurricane forecast.
They also require maintenance if their instruments break. If forecasters lose access to that data, they can’t accurately predict the strength of a hurricane and where it will make landfall: They might alert local authorities that an incoming storm will be a Category 3, only for it to spin up into a much more dangerous Category 5.
This is what’s known as rapid intensification, an increase in sustained wind speeds by at least 35 miles per hour within 24 hours. Last October, Hurricane Milton jumped 90 mph in a day before slamming into Florida. These rapid intensification events are happening much more frequently thanks to global warming heating up the oceans, and researchers are getting better at predicting them — thanks in no small part to NOAA’s data.
Once a hurricane arrives, NOAA scrambles aircraft to take still more measurements, which helps improve forecasts of future storms. If Congress approves the Trump administration’s proposed cuts to the agency, the Hurricane Research Division — which contributes crew to these “hurricane hunter” aircraft — would be shut down, according to Rick Spinrad, a former NOAA administrator. “Without the researchers being part of those flights,” Spinrad said, “the data they collect and contribute won’t be there anymore, and so the hurricane hunter efficiency goes down.”
While the Trump administration is slashing NOAA’s budget and staff ostensibly to save money, the agency actually saves Americans six dollars for every dollar invested in the agency, according to Justin Mankin, director of the Climate Modeling and Impacts Group at Dartmouth College. An accurate forecast can, for instance, help communities better prepare for extreme weather and mitigate any damage. Cutting jobs at NOAA, Mankin suspects, might be a step toward turning it into a for-profit entity, instead of one providing free data to hurricane researchers and the public at large.
“The institutions that are being taken apart by DOGE have some of the highest credibility and return on investment of any in the government,” Mankin said. “The perverse thing that seems to be happening here is that this is about a systematic degradation of the quality of the science coming out of these institutions and about instilling a loss of confidence.”
This story was originally published by Grist with the headline Scientists predict a brutal hurricane season while Trump takes aim at NOAA’s budget on Apr 17, 2025.
]]>
6633346
https://grist.org/health/el-eslabon-no-regulado-de-una-cadena-de-suministro-toxica/
Wed, 16 Apr 2025 22:25:18 +0000
https://grist.org/?p=663198
<

Unos niños juegan en un parque del barrio situado detrás del almacén de Cardinal Health en el este de El Paso. En la misma calle que la casa de Vanessa Domínguez, un hombre limpia su coche mientras su nieta juega y Cindy Martínez barre mientras su nieta, Emerie, juega. Sus casas se encuentran justo detrás del almacén de Cardinal en el este de El Paso. Ivan Pierre Aguirre / Grist
Ivan Pierre Aguirre / Grist
Una vez instalados, la hija de Domínguez se aficionó a corretear por el jardín, donde había un cerezo en flor, y la familia solía hacer barbacoas al aire libre. Domínguez apenas se fijó en el almacén que se encontraba justo detrás del muro de adoquines de su jardín. No fue hasta el mandato de permanecer en casa de COVID-19 en 2020 cuando se fijó en el flujo de camiones que entraban y salían de las instalaciones. A veces oía el estruendo de los camiones de 18 ruedas a las seis y media de la mañana.
Aun así, no le dio mucha importancia. No se daba cuenta de que el almacén era propiedad de Cardinal Health, uno de los mayores distribuidores de dispositivos médicos del país, ni de que formaba parte de una amplia cadena de suministro de la que depende la población estadounidense para recibir una atención médica adecuada.
Pero para Domínguez y su familia, lo que parecía poco más que una molestia menor era en realidad una amenaza creciente, que según un análisis de datos de Grist basado en registros estatales sugiere que podría estar exponiéndolos a niveles peligrosamente altos de un producto químico tóxico.

Cardinal Health utiliza ese almacén, y otro al otro lado de la ciudad, para guardar dispositivos médicos que han sido esterilizados con óxido de etileno. Entre los miles de compuestos que liberan cada día las instalaciones contaminantes, éste es uno de los más tóxicos, según la EPA, que descubrió en el año 2016 que el producto químico es mucho más peligroso de lo que se creía. Un análisis independiente de 2021 concluyó que es responsable de más de la mitad del riesgo excesivo de cáncer derivado de las operaciones industriales en todo el país. La exposición a largo plazo a este producto químico se ha relacionado con cánceres de mama y de los ganglios linfáticos, y la exposición a corto plazo puede causar irritación de la cavidad nasal, dificultad para respirar, sibilancias y constricción bronquial, según la Agencia para el Registro de Sustancias Tóxicas y Enfermedades. La familia de Domínguez llegaría a experimentar algunos de estos síntomas, pero sólo años más tarde sospecharían que estaban relacionados con la exposición al óxido de etileno.
Almacenes como los de El Paso son omnipresentes en todo el país. A través de solicitudes de acceso a la información y trabajo de campo, Grist ha identificado al menos 30 almacenes en Estados Unidos que almacenan productos esterilizados con óxido de etileno. Los utilizan empresas como Boston Scientific, ConMed y Becton Dickinson, así como Cardinal Health. Y no se encuentran sólo en zonas industriales de las ciudades: están cerca de colegios y parques infantiles, gimnasios y complejos de apartamentos. Desde fuera, los almacenes no llaman la atención. Parecen cualquier otro centro de distribución. Muchos ocupan cientos de miles de metros cuadrados y decenas de camiones entran y salen cada día. Pero cuando estas instalaciones cargan, descargan y trasladan productos médicos, expulsan óxido de etileno al aire. La mayoría de los vecinos no saben que estos edificios poco llamativos son una fuente de contaminación tóxica. Tampoco lo saben la mayoría de los camioneros, que a menudo son contratados de forma temporal, ni muchos de los empleados de los almacenes.
.eto-national-map {
–color-primary: #3c3830;
–color-secondary: #dfdfdf;
–color-tertiary: #ccc;
–color-background: #F0F0F0;
–typography-primary: “PolySans”, sans-serif;
–typography-secondary: “Basis Grotesque”, sans-serif;
–color-confirmed: #638d09;
–color-potential: #1d2903;
–color-graticule: #ccc;
–color-country-stroke: #ffffff;
–color-country-fill: rgba(60, 56, 48, 0.8);
–color-user-location: #007bff;
font-family: var(–typography-secondary);
margin: 0;
padding: 0;
position: relative;
width: 100%;
margin-bottom: 2rem;
box-sizing: border-box;
}
.eto-national-map * {
box-sizing: border-box;
}
.eto-national-map__container {
position: relative;
width: 50vw;
left: 50%;
transform: translateX(-50%);
margin-top: 2rem;
min-width: 320px;
box-sizing: border-box;
}
.eto-national-map__title {
margin: 0;
padding: 20px 0 5px;
font-size: 1.5rem;
text-align: left;
font-family: var(–typography-primary);
font-weight: normal;
}
.eto-national-map__subhed {
margin: 0 0 15px;
padding: 0;
font-size: 1rem;
text-align: left;
font-family: var(–typography-secondary);
font-weight: normal;
color: var(–color-primary);
line-height: 1.2;
}
.eto-national-map__search-container {
margin: 20px 0;
display: flex;
gap: 5px;
align-items: stretch;
flex-wrap: nowrap;
}
.eto-national-map__search-input {
flex-grow: 1;
padding: 8px 12px;
border: 1px solid var(–color-tertiary);
border-radius: 4px;
font-size: 14px;
font-family: var(–typography-secondary);
width: 100%;
}
.eto-national-map__search-button {
padding: 8px 15px;
background-color: var(–color-confirmed);
color: white;
border: none;
border-radius: 4px;
cursor: pointer;
font-size: 14px;
font-family: var(–typography-secondary);
transition: background-color 0.2s;
flex-shrink: 0;
width: auto;
line-height: normal;
}
.eto-national-map__search-button:hover {
background-color: #4a6a07;
}
.eto-national-map__search-results {
margin: 20px 0 40px;
font-size: 1rem;
font-style: normal;
color: var(–color-primary);
line-height: 1.2;
}
.eto-national-map__graticule {
fill: none;
stroke: var(–color-graticule);
stroke-width: 0.5px;
}
.eto-national-map__state {
fill: var(–color-country-fill);
}
.eto-national-map__state-borders {
fill: none;
stroke: var(–color-country-stroke);
stroke-width: 1.5px;
}
.eto-national-map__country-outline {
fill: none;
stroke: var(–color-primary);
stroke-width: 1px;
}
.eto-national-map__location-dot {
cursor: pointer;
transition: opacity 0.3s, r 0.3s;
}
.eto-national-map__location-dot.confirmed {
fill: var(–color-confirmed);
stroke: white;
stroke-width: 1px;
}
.eto-national-map__location-dot.potential {
fill: var(–color-potential);
stroke: white;
stroke-width: 1px;
}
.eto-national-map__tooltip {
position: absolute;
pointer-events: none;
background-color: rgba(255, 255, 255, 0.95);
color: var(–color-primary);
padding: 12px;
border-radius: 4px;
font-size: 12px;
z-index: 999;
opacity: 0;
transition: opacity 0.3s;
box-shadow: 0 2px 10px rgba(0, 0, 0, 0.15);
max-width: 300px;
border: 1px solid var(–color-tertiary);
}
.eto-national-map__tooltip.visible {
opacity: 1;
transform: translateY(0);
}
.eto-national-map__tooltip h3 {
margin: 0 0 8px 0;
padding-bottom: 6px;
border-bottom: 1px solid var(–color-tertiary);
font-size: 14px;
}
.eto-national-map__tooltip p {
margin: 3px 0;
font-size: 12px;
}
.eto-national-map__loading {
position: absolute;
top: 50%;
left: 50%;
transform: translate(-50%, -50%);
font-size: 18px;
color: var(–color-primary);
}
.eto-national-map__legend {
margin-top: 10px;
display: flex;
justify-content: center;
gap: 20px;
font-size: 1rem;
font-family: var(–typography-secondary);
margin-bottom: 10px;
}
.eto-national-map__legend-item {
display: flex;
align-items: center;
gap: 5px;
}
.eto-national-map__legend-dot {
width: 12px;
height: 12px;
border-radius: 50%;
stroke: white;
stroke-width: 1px;
}
.eto-national-map__legend-dot.confirmed {
background-color: var(–color-confirmed);
}
.eto-national-map__legend-dot.potential {
background-color: var(–color-potential);
}
.eto-national-map__puerto-rico-container {
position: absolute;
bottom: 5px;
right: 20px;
width: 150px;
height: 100px;
border: 1px solid var(–color-tertiary);
background-color: #f0f0f0;
border-radius: 4px;
overflow: hidden;
box-shadow: 0 2px 5px rgba(0, 0, 0, 0.1);
}
.eto-national-map__zoom-controls {
position: absolute;
bottom: 115px;
right: 20px;
display: flex;
flex-direction: column;
gap: 5px;
z-index: 10;
}
.eto-national-map__zoom-button {
width: 30px;
height: 30px;
background-color: #f0f0f0;
border: 1px solid var(–color-tertiary);
border-radius: 4px;
font-size: 18px;
font-weight: bold;
color: #3c3830;
cursor: pointer;
display: flex;
align-items: center;
justify-content: center;
box-shadow: 0 1px 3px rgba(0, 0, 0, 0.1);
transition: background-color 0.2s;
}
.eto-national-map__zoom-button:hover {
background-color: rgba(255, 255, 255, 1);
}
.eto-national-map__reset-button {
width: 30px;
height: 30px;
background-color: #f0f0f0;
border: 1px solid var(–color-tertiary);
border-radius: 4px;
font-size: 14px;
font-weight: normal;
color: #3c3830;
cursor: pointer;
display: flex;
align-items: center;
justify-content: center;
box-shadow: 0 1px 3px rgba(0, 0, 0, 0.1);
transition: background-color 0.2s;
padding: 0;
}
.eto-national-map__reset-button:hover {
background-color: rgba(255, 255, 255, 1);
}
.eto-national-map__pr-label {
font-size: 10px;
font-family: var(–typography-secondary);
fill: #f0f0f0;
text-anchor: middle;
text-transform: uppercase;
}
.eto-national-map__source {
color: #3c3830;
font-size: 12px;
text-align: left;
font-style: italic;
font-weight: bold;
margin-top: 5px;
padding-right: 0;
max-width: 60%;
}
.eto-national-map__source a {
text-decoration: underline;
}
@media (max-width: 768px) {
.eto-national-map {
width: 100%;
margin: 0;
}
.eto-national-map__container {
position: relative;
width: 100%;
max-width: none;
left: 0;
transform: none;
margin: 0;
padding: 0 1rem;
min-width: 0;
}
.eto-national-map__tooltip {
max-width: 260px;
padding: 14px;
font-size: 14px;
box-shadow: 0 4px 15px rgba(0, 0, 0, 0.2);
border: 1px solid var(–color-graticule);
background-color: rgba(255, 255, 255, 0.98);
}
.eto-national-map__tooltip p {
font-size: 14px !important;
margin: 5px 0 !important;
}
.eto-national-map__tooltip h3 {
font-size: 16px !important;
}
.eto-national-map__puerto-rico-container {
width: 120px;
height: 80px;
bottom: 2px;
right: 10px;
}
.eto-national-map__zoom-controls {
bottom: 95px;
right: 10px;
}
.eto-national-map__source {
font-size: 10px;
text-align: left;
padding-right: 10px;
max-width: 60%;
}
.eto-national-map__pr-label {
font-size: 8px;
}
.eto-national-map__search-container {
flex-direction: column;
align-items: stretch;
max-width: none;
}
.eto-national-map__search-input {
font-size: 16px;
}
.eto-national-map__search-button {
font-size: 16px;
padding: 10px 15px;
}
.eto-national-map__search-results {
font-size: 1rem;
}
}
.eto-national-map__suggestions-container {
position: relative;
flex-grow: 1;
}
.eto-national-map__suggestions-list {
position: absolute;
background-color: white;
border: 1px solid var(–color-tertiary);
border-top: none;
border-radius: 0 0 4px 4px;
list-style: none;
margin: 0;
padding: 0;
width: 100%;
max-height: 200px;
overflow-y: auto;
z-index: 1000;
box-shadow: 0 4px 6px rgba(0, 0, 0, 0.1);
display: none;
}
.eto-national-map__suggestions-list.visible {
display: block;
}
.eto-national-map__suggestions-item {
padding: 8px 12px;
cursor: pointer;
font-size: 13px;
border-bottom: 1px solid var(–color-secondary);
}
.eto-national-map__suggestions-item:last-child {
border-bottom: none;
}
.eto-national-map__suggestions-item:hover {
background-color: var(–color-background);
}
Almacenes que albergan productos esterilizados con óxido de etileno
Grist recopiló una lista de bodegas en Estados Unidos que informaron que almacenan productos esterilizados con óxido de etileno y otros utilizados por los principales fabricantes y distribuidores de dispositivos médicos.
Confirmados
Potenciales
let mapInitialized = false; // Flag to prevent multiple initializations
function initMap() {
if (mapInitialized) return; // Exit if already initialized
if (typeof d3 === ‘undefined’ || typeof topojson === ‘undefined’) {
setTimeout(initMap, 100);
return;
}
mapInitialized = true; // Set flag after dependency check
document.addEventListener(‘touchstart’, function(event) {
const tooltip = document.getElementById(‘tooltip’);
const target = event.target;
if (!target.classList.contains(‘eto-national-map__location-dot’) && tooltip) {
hideTooltip();
}
}, { passive: false });
document.addEventListener(‘click’, function(event) {
const tooltip = document.getElementById(‘tooltip’);
const target = event.target;
if (!target.classList.contains(‘eto-national-map__location-dot’) && tooltip) {
hideTooltip();
}
});
const width = 1000;
const height = 600;
const margin = { top: 10, right: 20, bottom: 40, left: 20 };
const svg = d3.select(“#map”).append(“svg”)
.attr(“width”, “100%”)
.attr(“height”, “100%”)
.attr(“viewBox”, `0 0 ${width} ${height}`)
.attr(“preserveAspectRatio”, “xMidYMid meet”)
.style(“max-width”, “100%”)
.style(“height”, “auto”);
const defs = svg.append(“defs”);
const filter = defs.append(“filter”)
.attr(“id”, “drop-shadow”)
.attr(“height”, “130%”);
filter.append(“feGaussianBlur”)
.attr(“in”, “SourceAlpha”)
.attr(“stdDeviation”, 3)
.attr(“result”, “blur”);
filter.append(“feOffset”)
.attr(“in”, “blur”)
.attr(“dx”, 2)
.attr(“dy”, 2)
.attr(“result”, “offsetBlur”);
filter.append(“feFlood”)
.attr(“flood-color”, “#3c3830”)
.attr(“flood-opacity”, 0.3)
.attr(“result”, “offsetColor”);
filter.append(“feComposite”)
.attr(“in”, “offsetColor”)
.attr(“in2”, “offsetBlur”)
.attr(“operator”, “in”)
.attr(“result”, “offsetBlur”);
const feMerge = filter.append(“feMerge”);
feMerge.append(“feMergeNode”)
.attr(“in”, “offsetBlur”)
feMerge.append(“feMergeNode”)
.attr(“in”, “SourceGraphic”);
const prContainer = d3.select(“#map”).append(“div”)
.attr(“class”, “eto-national-map__puerto-rico-container”);
const prSvg = prContainer.append(“svg”)
.attr(“width”, “100%”)
.attr(“height”, “100%”)
.attr(“viewBox”, “0 0 150 100”)
.attr(“preserveAspectRatio”, “xMidYMid meet”);
const tooltip = d3.select(“#tooltip”);
const projection = d3.geoAlbersUsa()
.scale(1200)
.translate([width / 2, height / 2]);
const prProjection = d3.geoMercator()
.center([-66.5, 18.2])
.scale(4000)
.translate([75, 50]);
const path = d3.geoPath().projection(projection);
const prPath = d3.geoPath().projection(prProjection);
const g = svg.append(“g”);
const baseDotRadius = 9;
const baseStrokeWidth = 1;
const prBaseDotRadius = 6;
async function loadData() {
try {
const csvData = await d3.csv(“https://raw.githubusercontent.com/Grist-Data-Desk/eto-warehouses/refs/heads/main/eto-warehouses.csv”);
return csvData.map(d => ({
company: d.Company,
address: d[“Warehouse Address”],
state: d.State,
source: d.Source,
type: d.Type,
latitude: +d.Latitude,
longitude: +d.Longitude
}));
} catch (error) {
console.error(“Error loading CSV data:”, error);
return [];
}
}
async function drawMap() {
try {
const us = await d3.json(“https://cdn.jsdelivr.net/npm/us-atlas@3/states-10m.json”);
const warehouseData = await loadData();
d3.select(“.eto-national-map__loading”).remove();
const states = topojson.feature(us, us.objects.states);
const statesMesh = topojson.mesh(us, us.objects.states);
g.append(“g”)
.attr(“filter”, “url(#drop-shadow)”)
.selectAll(“path”)
.data(states.features)
.enter().append(“path”)
.attr(“class”, “eto-national-map__state”)
.attr(“d”, path);
g.append(“path”)
.datum(statesMesh)
.attr(“class”, “eto-national-map__state-borders”)
.attr(“d”, path);
g.append(“path”)
.datum(topojson.mesh(us, us.objects.states, (a, b) => a === b))
.attr(“class”, “eto-national-map__country-outline”)
.attr(“d”, path);
const puertoRico = us.objects.states.geometries.find(d => d.id === “72”);
if (puertoRico) {
const prFeature = topojson.feature(us, {
type: “GeometryCollection”,
geometries: [puertoRico]
});
prSvg.append(“g”)
.selectAll(“path”)
.data(prFeature.features)
.enter().append(“path”)
.attr(“class”, “eto-national-map__state”)
.attr(“d”, prPath);
prSvg.append(“path”)
.datum(prFeature)
.attr(“class”, “eto-national-map__country-outline”)
.attr(“d”, prPath);
prSvg.append(“text”)
.attr(“class”, “eto-national-map__pr-label”)
.attr(“x”, 75)
.attr(“y”, 51)
.text(“Puerto Rico”);
}
const mainlandPoints = warehouseData.filter(d =>
!isNaN(d.latitude) && !isNaN(d.longitude) &&
!(d.state === “PR” || d.state === “Puerto Rico”));
const puertoRicoPoints = warehouseData.filter(d =>
!isNaN(d.latitude) && !isNaN(d.longitude) &&
(d.state === “PR” || d.state === “Puerto Rico”));
g.selectAll(“.eto-national-map__location-dot.mainland”)
.data(mainlandPoints)
.enter()
.append(“circle”)
.attr(“class”, d => `eto-national-map__location-dot mainland ${d.type.toLowerCase() === “confirmed” ? “confirmed” : “potential”}`)
.attr(“cx”, d => {
const coords = projection([d.longitude, d.latitude]);
return coords ? coords[0] : null;
})
.attr(“cy”, d => {
const coords = projection([d.longitude, d.latitude]);
return coords ? coords[1] : null;
})
.attr(“r”, baseDotRadius)
.style(“stroke-width”, baseStrokeWidth)
.style(“opacity”, 0.8)
.on(“mouseover”, function(event, d) {
const currentScale = d3.zoomTransform(svg.node()).k || 1;
d3.select(this)
.transition()
.duration(200)
.attr(“r”, baseDotRadius * 1.3 / currentScale)
.style(“opacity”, 1);
showTooltip(event, d);
})
.on(“mouseout”, function() {
const currentScale = d3.zoomTransform(svg.node()).k || 1;
d3.select(this)
.transition()
.duration(200)
.attr(“r”, baseDotRadius / currentScale)
.style(“opacity”, 0.8);
hideTooltip();
})
.on(“touchstart”, function(event, d) {
event.preventDefault();
const wasVisible = tooltip.classed(“visible”);
hideTooltip();
const currentScale = d3.zoomTransform(svg.node()).k || 1;
d3.select(this)
.attr(“r”, wasVisible ? baseDotRadius / currentScale : baseDotRadius * 1.3 / currentScale)
.style(“opacity”, wasVisible ? 0.8 : 1);
if (!wasVisible) {
showTooltip(event.touches[0], d);
} else {
d3.select(this)
.transition()
.duration(200)
.attr(“r”, baseDotRadius / currentScale)
.style(“opacity”, 0.8);
}
});
prSvg.selectAll(“.eto-national-map__location-dot.puerto-rico”)
.data(puertoRicoPoints)
.enter()
.append(“circle”)
.attr(“class”, d => `eto-national-map__location-dot puerto-rico ${d.type.toLowerCase() === “confirmed” ? “confirmed” : “potential”}`)
.attr(“cx”, d => {
const coords = prProjection([d.longitude, d.latitude]);
return coords ? coords[0] : null;
})
.attr(“cy”, d => {
const coords = prProjection([d.longitude, d.latitude]);
return coords ? coords[1] : null;
})
.attr(“r”, prBaseDotRadius)
.style(“opacity”, 0.8)
.on(“mouseover”, function(event, d) {
d3.select(this)
.transition()
.duration(200)
.attr(“r”, prBaseDotRadius * 1.3)
.style(“opacity”, 1);
const rect = prSvg.node().getBoundingClientRect();
const evt = {
clientX: rect.left + parseFloat(d3.select(this).attr(“cx”)),
clientY: rect.top + parseFloat(d3.select(this).attr(“cy”))
};
showTooltip(evt, d);
})
.on(“mouseout”, function() {
d3.select(this)
.transition()
.duration(200)
.attr(“r”, prBaseDotRadius)
.style(“opacity”, 0.8);
hideTooltip();
})
.on(“touchstart”, function(event, d) {
event.preventDefault();
const wasVisible = tooltip.classed(“visible”);
hideTooltip();
if (!wasVisible) {
d3.select(this)
.transition()
.duration(200)
.attr(“r”, prBaseDotRadius * 1.3)
.style(“opacity”, 1);
const rect = prSvg.node().getBoundingClientRect();
const evt = {
clientX: rect.left + parseFloat(d3.select(this).attr(“cx”)),
clientY: rect.top + parseFloat(d3.select(this).attr(“cy”))
};
showTooltip(evt, d);
}
});
const zoom = d3.zoom()
.scaleExtent([1, 8])
.on(“zoom”, zoomed);
svg.call(zoom);
d3.select(“#zoom-in”).on(“click”, function() {
svg.transition().duration(300).call(zoom.scaleBy, 1.3);
});
d3.select(“#zoom-out”).on(“click”, function() {
svg.transition().duration(300).call(zoom.scaleBy, 1 / 1.3);
});
zoomed({ transform: d3.zoomIdentity });
const searchInput = d3.select(“#address-input”);
const searchButton = d3.select(“#search-button”);
const searchResults = d3.select(“#search-results”);
const suggestionsList = d3.select(“#search-suggestions”);
let currentSuggestions = [];
async function fetchSuggestions(query) {
if (!query || query.length 0) {
suggestions.forEach((item, index) => {
suggestionsList.append(“li”)
.attr(“class”, “eto-national-map__suggestions-item”)
.text(item.display_name)
.on(“click”, () => {
selectSuggestion(index);
});
});
suggestionsList.classed(“visible”, true);
} else {
hideSuggestions();
}
} else {
hideSuggestions();
}
}
function hideSuggestions() {
suggestionsList.classed(“visible”, false);
currentSuggestions = [];
}
function selectSuggestion(index) {
if (index = currentSuggestions.length) return;
const selected = currentSuggestions[index];
searchInput.property(“value”, selected.display_name);
hideSuggestions();
searchResults.text(“Processing selected location…”);
processSelectedLocation(selected);
}
async function handleSearch() {
const query = searchInput.property(“value”).trim();
hideSuggestions();
if (!query) {
searchResults.text(“Please enter an address or zip code.”);
return;
}
searchResults.text(“Buscando…”);
removeUserMarker();
try {
const response = await fetch(`https://nominatim.openstreetmap.org/search?format=json&q=${encodeURIComponent(query)}&countrycodes=us,pr&limit=1`, {
headers: {
‘User-Agent’: ‘Grist EtO Warehouse Map/1.0 (contact: caldern@grist.org)’
}
});
if (!response.ok) throw new Error(`HTTP error! status: ${response.status}`);
const data = await response.json();
if (data && data.length > 0) {
processSelectedLocation(data[0]);
} else {
searchResults.text(“Address not found. Please try a different search.”);
}
} catch (error) {
console.error(“Error during geocoding search:”, error);
searchResults.text(“Error searching for address. Please try again later.”);
}
}
function processSelectedLocation(locationData) {
const userLat = parseFloat(locationData.lat);
const userLon = parseFloat(locationData.lon);
const displayName = locationData.display_name;
const userLocation = { longitude: userLon, latitude: userLat };
searchInput.property(“value”, displayName);
removeUserMarker();
addUserMarker(userLocation);
const coords = projection([userLon, userLat]);
let mapPanningMessage = “”;
if (coords) {
svg.transition().duration(750).call(
zoom.transform,
d3.zoomIdentity.translate(width / 2, height / 2).scale(4).translate(-coords[0], -coords[1])
);
} else {
mapPanningMessage = ” (Map panning only available for mainland US)”;
}
const nearest = findNearestWarehouse(userLocation, mainlandPoints.concat(puertoRicoPoints));
const locationSpan = `📍 `;
const warehouseSpan = `🚚 `;
let warehouseText = “No nearby warehouses found.”;
if (nearest) {
const distance = calculateDistance(userLat, userLon, nearest.warehouse.latitude, nearest.warehouse.longitude);
const warehouseTypeRaw = nearest.warehouse.type.toLowerCase();
const warehouseTypeSpanish = warehouseTypeRaw === ‘confirmed’ ? ‘confirmado’ : (warehouseTypeRaw === ‘potential’ ? ‘potencial’ : warehouseTypeRaw);
const warehouseName = nearest.warehouse.company;
warehouseText = `Almacén ${warehouseTypeSpanish} más cercano: ${warehouseName} (${distance.toFixed(1)} millas de distancia)`;
highlightWarehouse(nearest.warehouse);
}
const locationString = `${locationSpan}Ubicación buscada: ${displayName}${mapPanningMessage}`;
const finalHtml = `${locationString}
${warehouseSpan}${warehouseText}`;
searchResults.html(finalHtml);
}
searchInput.on(“input”, function() {
const query = searchInput.property(“value”).trim();
fetchSuggestions(query).catch(error => console.error(“Error in fetchSuggestions call:”, error));
});
d3.select(document).on(“click”, function(event) {
const target = event.target;
const isInput = target === searchInput.node();
const isSuggestion = suggestionsList.node().contains(target);
if (!isInput && !isSuggestion) {
hideSuggestions();
}
});
searchButton.on(“click”, handleSearch);
searchInput.on(“keypress”, function(event) {
if (event.key === “Enter”) {
event.preventDefault();
handleSearch();
}
});
function calculateDistance(lat1, lon1, lat2, lon2) {
const R = 3958.8; // Radius of the Earth in miles
const dLat = (lat2 – lat1) * Math.PI / 180;
const dLon = (lon2 – lon1) * Math.PI / 180;
const a =
Math.sin(dLat / 2) * Math.sin(dLat / 2) +
Math.cos(lat1 * Math.PI / 180) * Math.cos(lat2 * Math.PI / 180) *
Math.sin(dLon / 2) * Math.sin(dLon / 2);
const c = 2 * Math.atan2(Math.sqrt(a), Math.sqrt(1 – a));
return R * c; // Distance in miles
}
function findNearestWarehouse(userLocation, warehouses) {
let minDistance = Infinity;
let nearestWarehouse = null;
warehouses.forEach(warehouse => {
if (!isNaN(warehouse.latitude) && !isNaN(warehouse.longitude)) {
const distance = calculateDistance(userLocation.latitude, userLocation.longitude, warehouse.latitude, warehouse.longitude);
if (distance d.company === warehouse.company && d.address === warehouse.address);
if (!dot.empty()) {
const currentScale = d3.zoomTransform(svg.node()).k || 1;
dot.raise()
.classed(“highlighted”, true)
.transition()
.duration(300)
.attr(“r”, baseDotRadius * 1.5 / currentScale)
.style(“stroke”, “var(–color-user-location)”)
.style(“stroke-width”, 2 / currentScale);
}
}
function resetMap() {
svg.transition().duration(750).call(zoom.transform, d3.zoomIdentity);
searchInput.property(“value”, “”);
searchResults.text(“”);
hideSuggestions();
removeUserMarker();
g.selectAll(“.eto-national-map__location-dot.highlighted”)
.classed(“highlighted”, false)
.transition()
.duration(200)
.style(“stroke”, “white”)
.attr(“r”, baseDotRadius / (d3.zoomTransform(svg.node()).k || 1))
.style(“stroke-width”, baseStrokeWidth / (d3.zoomTransform(svg.node()).k || 1));
}
d3.select(“#reset-view”).on(“click”, resetMap);
} catch (error) {
console.error(“Error drawing map:”, error);
d3.select(“.eto-national-map__loading”).text(“Error loading map data. Please try again later.”);
}
}
function zoomed(event) {
const { transform } = event;
g.attr(“transform”, transform);
g.selectAll(“.eto-national-map__location-dot.mainland”)
.attr(“r”, baseDotRadius / transform.k)
.style(“stroke-width”, baseStrokeWidth / transform.k);
g.selectAll(“.eto-national-map__state-borders”)
.style(“stroke-width”, baseStrokeWidth / transform.k);
g.selectAll(“.eto-national-map__country-outline”)
.style(“stroke-width”, baseStrokeWidth / transform.k);
g.select(“#user-location-marker”)
.attr(“r”, 8 / transform.k)
.attr(“stroke-width”, 1.5 / transform.k);
g.selectAll(“.eto-national-map__location-dot.highlighted”)
.attr(“r”, baseDotRadius * 1.5 / transform.k)
.style(“stroke-width”, 2 / transform.k);
}
function showTooltip(event, d) {
const mapContainer = document.querySelector(‘.eto-national-map__container’).getBoundingClientRect();
const tooltipWidth = window.innerWidth <= 768 ? 260 : 250;
const tooltipHeight = window.innerWidth mapContainer.width) {
tooltipX = mouseX – tooltipWidth – tooltipOffset;
}
if (tooltipY + tooltipHeight > mapContainer.height) {
tooltipY = mouseY – tooltipHeight – tooltipOffset;
}
tooltipX = Math.max(10, Math.min(mapContainer.width – tooltipWidth – 10, tooltipX));
tooltipY = Math.max(10, Math.min(mapContainer.height – tooltipHeight – 10, tooltipY));
const statusRaw = d.type || ”;
const statusSpanish = statusRaw.toLowerCase() === ‘confirmed’ ? ‘Confirmado’ : (statusRaw.toLowerCase() === ‘potential’ ? ‘Potencial’ : statusRaw);
const tooltipContent = `
${d.company}
Dirección: ${d.address}
Estado: ${d.state}
Estatus: ${statusSpanish}
`;
tooltip
.style(“left”, `${tooltipX}px`)
.style(“top”, `${tooltipY}px`)
.html(tooltipContent)
.classed(“visible”, true)
.style(“opacity”, 1);
}
function hideTooltip() {
tooltip.classed(“visible”, false).style(“opacity”, 0);
}
drawMap();
}
if (document.readyState === ‘loading’) {
document.addEventListener(‘DOMContentLoaded’, initMap);
} else {
initMap();
}
Grist identificó a los principales fabricantes y distribuidores de dispositivos médicos del país y recopiló una lista de aproximadamente 100 almacenes de los que son propietarios o que utilizan. Algunas de estas empresas han informado a los reguladores estatales o federales de que gestionan al menos un centro de distribución que almacena productos esterilizados con óxido de etileno. Otros fueron identificados en persona por los reporteros de Grist como destinatarios de productos procedentes de instalaciones de esterilización. Pero como las empresas utilizan múltiples métodos de esterilización, no está claro si cada uno de ellos emite óxido de etileno. No obstante, Grist decidió publicar la información para demostrar la magnitud del problema potencial: es casi seguro que hay docenas, si no cientos, de almacenes más que los 30 de los que tenemos certeza, y miles de trabajadores más expuestos al óxido de etileno sin saberlo.
Identificar estos almacenes y los cerca de 30 que emiten alguna cantidad de óxido de etileno fue un proceso laborioso, en parte porque la información acerca de estas instalaciones no está fácilmente disponible. Los reporteros de Grist vigilaron las instalaciones de esterilización, hablaron con camioneros y trabajadores de almacenes, y buscaron en bases de datos de propiedades.
El problema es «mucho mayor de lo que todos suponemos», afirma Rick Peltier, catedrático de Ciencias de la Salud Medioambiental de la Universidad de Massachusetts. «La falta de transparencia sobre el destino de estos productos nos preocupa».

En el almacén de El Paso, detrás de la casa de Domínguez, Grist habló con varios empleados de Cardinal que dijeron que sabían poco sobre los riesgos de estar expuestos al óxido de etileno. Cardinal Health, que emplea a una mano de obra mayoritariamente latina en el almacén, exige que algunos obreros lleven monitores y mantengan ventanas y rejillas de ventilación abiertas para la circulación. Pero los trabajadores con los que habló Grist no sabían qué es lo que está monitorizando la empresa.
«Creo que se debe a un tipo de gas que estamos respirando», dijo un trabajador a Grist mientras descansaba. «No sé cómo se llama».
A lo largo del último año, Grist se ha puesto en contacto con Cardinal Health en múltiples ocasiones. La empresa no facilitó representantes para entrevistas ni respondió a preguntas concretas por escrito. En respuesta a la lista de almacenes de Cardinal que Grist identificó, un portavoz señaló en un breve comentario que la «mayoría de las direcciones que usted ha enumerado ni siquiera son instalaciones médicas». Sin embargo, las ubicaciones de los almacenes se corroboraron con información disponible en el sitio web de la empresa.

Las operaciones de Cardinal se extienden al otro lado de la frontera entre Estados Unidos y México. La empresa tiene una fábrica en Ciudad Juárez (México), donde se empaquetan gasas, batas quirúrgicas, sábanas, escalpelos y otros utensilios médicos en kits que proporcionan «todo lo que un médico necesita» para llevar a cabo una intervención quirúrgica, según explica un trabajador. Los kits terminados se transportan en camión de vuelta a El Paso o a Nuevo México, donde son esterilizados con óxido de etileno por terceras empresas contratadas por Cardinal. A continuación, los productos se transportan en camión a uno de los dos almacenes de Cardinal en El Paso, donde permanecen hasta que se envían a los hospitales de todo el país. Durante todo el trayecto, en los camiones que los transportan y en los almacenes que los guardan, la superficie de los dispositivos esterilizados desprende óxido de etileno, un proceso llamado desgasificación.
La Agencia de Protección Ambiental de Estados Unidos (U.S. Environmental Protection Agency o EPA) regula las instalaciones donde se esterilizan los productos sanitarios, controlando los procesos y los protocolos de seguridad para mantener las emisiones de óxido de etileno en niveles seguros. Pero por múltiples razones, el gobierno federal —y la gran mayoría de los estados— ha hecho la vista gorda con los almacenes. Y ello a pesar de que estos centros de almacenamiento liberan a veces más óxido de etileno y suponen un riesgo mayor que las instalaciones de esterilización. Los reguladores de Georgia encontraron que ese era el caso en 2019, y un análisis de Grist encontró que el almacén junto a la casa de Domínguez planteaba una amenaza mayor que la instalación de esterilización de Nuevo México de la que Cardinal recibe productos.

Ivan Pierre Aguirre / Grist

Ivan Pierre Aguirre / Grist
«La EPA sabe que los riesgos del óxido de etileno se extienden mucho más allá de las paredes de la instalación de esterilización», dijo Jonathan Kalmuss-Katz, abogado de la organización medioambiental sin fin de lucro Earthjustice que trabaja con sustancias químicas tóxicas, «que la sustancia química permanece con el equipo cuando se lleva a un almacén, y que sigue liberándose, amenazando a los trabajadores y amenazando a las comunidades circundantes.»
«La EPA tenía la obligación legal de abordar esos riesgos», añadió.

En 2009, Cardinal Health se puso en contacto con la Comisión de Calidad Medioambiental de Texas (Texas Commission on Environmental Quality o TCEQ), el regulador medioambiental estatal, para solicitar permisos para sus emisiones de óxido de etileno. En ese momento, no se sabía que el compuesto químico era tan tóxico como lo es en realidad, y los funcionarios de la TCEQ hicieron pocas preguntas sobre el efecto que las emisiones tendrían para los residentes cercanos. El informe de Grist indica que la empresa no tenía ninguna responsabilidad legal de informar a las autoridades estatales, pero parece haberlo hecho como un acto de responsabilidad. La empresa no parece estar infringiendo ninguna norma estatal ni federal.
Las solicitudes de la empresa incluían un diagrama rudimentario de un camión llegando a un almacén, una flecha apuntando al aire para indicar las emisiones de óxido de etileno de la instalación, y un camión saliendo del almacén. «Debido a la descarga de los camiones con remolque, Cardinal Health está registrando el EtO fugitivo que se escapa al abrir cada uno de los remolques», señaló, utilizando la abreviación para el óxido de etileno.
Para calcular qué cantidad de la sustancia química se escapaba de los camiones que transportan productos esterilizados, Cardinal Health, siguiendo las instrucciones de la TCEQ durante el proceso de obtención de permisos, utilizó un modelo de la EPA desarrollado para los sistemas de tratamiento de aguas residuales y multiplicó la estimación por el número de camiones que esperaba que dejaran productos cada año. No está claro por qué la agencia dio instrucciones a Cardinal Health para que utilizara un modelo de aguas residuales para un contaminante atmosférico cuando existían alternativas, pero estos cálculos imprecisos llevaron a la empresa a calcular que sus operaciones de almacenamiento emitían al menos 479 libras al año. La TCEQ concedió los permisos a Cardinal sin exigir a la empresa que tomara medidas para reducir la contaminación ni que avisara a los residentes.
Cuatro años después, la empresa parecía haber hecho un esfuerzo por determinar cálculos más precisos. En un experimento realizado en 2013, la empresa instaló sopladores en un camión y midió la cantidad de óxido de etileno emitido, pero no incluyó otros detalles relevantes —como cuándo se realizaron las mediciones y cuántos productos transportaba el camión— en los registros de la TCEQ que Grist revisó. Cardinal descubrió que, en los primeros cinco minutos después de que un camión entra en el almacén, los productos esterilizados emiten óxido de etileno en sus niveles más altos. Pero después de cinco minutos, en lugar de reducirse a cero, los niveles de desgasificación se mantuvieron estables en 7 partes por millón durante las dos horas siguientes.
Jesse Nichols / Parker Ziegler / Grist
const link = document.createElement(“link”);
link.rel = “stylesheet”;
link.crossOrigin = “”;
link.href =
“https://grist.nyc3.cdn.digitaloceanspaces.com/eto-pt3-es/dist/assets/index-D6P3lZvj.css”;
document.head.appendChild(link);
Los documentos disponibles al público no ofrecen detalles sobre la procedencia de los camiones, el número de paquetes que transportaban o el tiempo que hacía que se habían esterilizado los productos —detalles clave que determinan la velocidad a la que el óxido de etileno se desprende, según Peltier. Si los dispositivos médicos en el camión que examinó Cardinal recorrieron una distancia corta o si el camión estaba casi vacío cuando se realizó el experimento, la empresa podría haber subestimado enormemente las emisiones.
«Demasiadas veces, estos permisos son sólo esperanzas y sueños», dijo Peltier. «En la práctica, como hemos aprendido en muchas de estas instalaciones, nuestras esperanzas y sueños no siempre se cumplen, y a veces tenemos emisiones mucho mayores de las que esperábamos. Y eso es lo que esperaría aquí».
Además, los análisis no tomaron en cuenta las emisiones de óxido de etileno una vez que los productos fueron trasladados al interior de las instalaciones de Cardinal.
Los toxicólogos llevan mucho tiempo identificando el óxido de etileno como una sustancia química peligrosa. En 1982, el Centro de Recursos para la Salud Laboral de la Mujer de la Universidad de Columbia publicó una serie de hojas informativas para educar a los trabajadores sobre esta sustancia química, y en 1995, la Biblioteca del Congreso publicó un estudio sobre los riesgos de utilizar el gas para desinfectar materiales de archivo. Sin embargo, no fue hasta 2016 cuando la EPA actualizó el valor de toxicidad del óxido de etileno, una cifra que define la probabilidad de desarrollar cáncer si uno está expuesto a una determinada cantidad de una sustancia química a lo largo de la vida. Ese mismo año, la agencia publicó un informe en el que reevaluaba el óxido de etileno utilizando un estudio epidemiológico de más de 18.000 trabajadores de instalaciones de esterilización. Los toxicólogos de la agencia determinaron que el producto químico era 30 veces más tóxico para los adultos y 60 veces más tóxico para los niños de lo que se creía anteriormente.
Datos sobre el óxido de etileno
Determinaron que el óxido de etileno era uno de los contaminantes del aire más tóxicos regulados por el gobierno federal. La exposición prolongada se relacionó con tasas elevadas de linfoma y cáncer de mama entre las trabajadoras. En un estudio de 7.576 mujeres que habían pasado al menos un año trabajando en una instalación de esterilización médica, 319 desarrollaron cáncer de mama. Según un análisis de la organización sin fines de lucro Unión de Científicos Conscientes, aproximadamente 14 millones de personas en Estados Unidos viven cerca de una instalación de esterilización médica.
Como resultado de la nueva evaluación de la EPA, las empresas de todo el país se vieron sometidas a un mayor escrutinio, y algunas instalaciones de esterilización comenzaron a recibir inspecciones más frecuentes. Pero los reguladores de Texas cuestionaron el informe de la EPA. En 2017, ocho años después del primer permiso concedido a Cardinal Health, la TCEQ lanzó su propio estudio sobre el producto químico y estableció un umbral para las emisiones de óxido de etileno que era 2.000 veces más permisivo que el de la EPA, lo que desencadenó una batalla legal que aún se está desarrollando en los tribunales. En el caso de los almacenes, que no están sujetos al escrutinio federal, la actitud permisiva de la TCEQ se tradujo en una supervisión prácticamente nula.
A principios de 2020, la gente de todo el mundo tenía poca energía para otra cosa que no fuera la pandemia de COVID-19. Y, sin embargo, el aumento de la demanda de dispositivos médicos esterilizados y luego mascarillas significaba que más camiones con más materiales pasaban por almacenes como el que está justo detrás del patio trasero de los Domínguez.
Para calcular aproximadamente el nivel de exposición de su familia al óxido de etileno durante ese periodo, Grist pidió a un experto en modelización del aire, que pasara las emisiones declaradas por Cardinal Health por un modelo matemático que simula cómo se dispersan las partículas contaminantes por la atmósfera. (Este mismo modelo es utilizado por la EPA y las empresas, incluida Cardinal, durante el proceso de obtención de permisos). Grist recopiló la información sobre las emisiones a partir de los archivos de permisos que la empresa había presentado al estado.
Los resultados indicaron que las concentraciones de óxido de etileno en el bloque de Domínguez equivalían a un riesgo de cáncer estimado de 2 entre 10.000; es decir, si 10.000 personas están expuestas a esa concentración de óxido de etileno a lo largo de su vida, cabría esperar que dos desarrollaran cáncer a causa de la exposición.
.cardinal-vanessa-container {
max-width: 1200px;
margin-top: 25px;
padding: 0;
font-family: ‘Basis Grotesque’, Arial, sans-serif;
overflow-x: hidden;
}
.cardinal-vanessa-container * {
box-sizing: border-box;
}
.cardinal-vanessa-map-container {
position: relative;
width: 100%;
margin-bottom: 10px;
}
.cardinal-vanessa-map-image {
width: 100%;
height: auto;
display: block;
}
.cardinal-vanessa-annotation {
position: absolute;
pointer-events: none;
z-index: 10;
}
.cardinal-vanessa-annotation-text {
color: white;
font-size: 16px;
text-shadow: 1px 1px 3px rgba(0, 0, 0, 0.8);
white-space: normal;
max-width: 150px;
line-height: 1.2;
}
.cardinal-vanessa-arrow {
position: absolute;
z-index: 5;
}
.cardinal-vanessa-scale-bar {
position: absolute;
bottom: 20px;
right: 20px;
color: white;
font-size: 14px;
text-shadow: 1px 1px 3px rgba(0, 0, 0, 0.8);
display: flex;
flex-direction: column;
align-items: flex-end;
}
.cardinal-vanessa-scale-line {
height: 2px;
background-color: white;
margin-top: 2px;
box-shadow: 1px 1px 3px rgba(0, 0, 0, 0.8);
}
.cardinal-vanessa-map-footer {
display: flex;
justify-content: space-between;
align-items: flex-end;
width: 100%;
}
.cardinal-vanessa-source-container {
color: #3c3830;
font-size: 12px;
text-align: left;
font-style: italic;
font-weight: bold;
}
.cardinal-vanessa-source-line {
margin-bottom: 3px;
}
.cardinal-vanessa-risk-legend {
color: #3c3830;
display: flex;
flex-direction: column;
align-items: flex-end;
}
.cardinal-vanessa-risk-title {
font-size: 14px;
text-align: right;
margin-bottom: 5px;
}
.cardinal-vanessa-risk-scale {
display: flex;
justify-content: flex-end;
align-items: flex-start;
margin-top: 5px;
width: auto;
}
.cardinal-vanessa-risk-level {
text-align: center;
font-size: 10px;
width: 40px;
margin-left: 0;
}
.cardinal-vanessa-risk-color {
width: 100%;
height: 20px;
display: block;
margin-bottom: 3px;
border-top: 1px solid #3c3830;
border-bottom: 1px solid #3c3830;
border-left: 1px solid #3c3830;
}
.cardinal-vanessa-risk-level:last-child .cardinal-vanessa-risk-color {
border-right: 1px solid #3c3830;
}
@media (max-width: 768px) {
.cardinal-vanessa-annotation-text {
font-size: 14px;
}
.cardinal-vanessa-map-footer {
flex-direction: row;
align-items: flex-end;
}
.cardinal-vanessa-source-container {
font-size: 10px;
text-align: left;
flex-basis: 40%;
max-width: 40%;
}
.cardinal-vanessa-scale-bar {
font-size: 12px;
}
.cardinal-vanessa-risk-legend {
flex-grow: 1;
}
.cardinal-vanessa-risk-title {
font-size: 12px;
margin-bottom: 4px;
text-align: right;
}
.cardinal-vanessa-risk-scale {
flex-wrap: wrap;
justify-content: flex-end;
}
.cardinal-vanessa-risk-level {
font-size: 9px;
width: 35px;
margin-bottom: 5px;
}
.cardinal-vanessa-risk-color {
width: 100%;
height: 15px;
margin-bottom: 2px;
border-top: 1px solid #3c3830;
border-bottom: 1px solid #3c3830;
border-left: 1px solid #3c3830;
}
}

document.addEventListener(‘DOMContentLoaded’, function() {
const mapContainer = d3.select(‘.cardinal-vanessa-map-container’);
const annotationsContainer = d3.select(‘#annotationsVanessa’);
const mapImageVanessa = d3.select(‘#mapImageVanessa’);
const riskLegendContainer = d3.select(‘#riskLegendVanessa’);
const scaleLine = d3.select(‘.cardinal-vanessa-scale-line’);
const scaleText = d3.select(‘#scaleTextVanessa’);
const annotationsData = [
{
text: “Almacén de Cardinal Health en Don Haskins Dr.”,
desktop: { position: { x: 29, y: 25 } },
mobile: { position: { x: 13, y: 15 } },
arrowOrigin: ‘bottom’,
arrowEnd: { x: 49.75, y: 46 }
},
{
text: “Manzana Vanessa”,
desktop: { position: { x: 50, y: 55 } },
mobile: { position: { x: 50, y: 70 } },
arrowOrigin: ‘top’,
arrowEnd: { x: 53.25, y: 47 }
}
];
const riskLegendData = {
title: “Riesgo de cáncer”,
levels: [
{ text: “1 en 1 millón”, color: “#D8CFD8” },
{ text: “”, color: “#B5BFBA” },
{ text: “1 en 100.000”, color: “#79AD72” },
{ text: “”, color: “#6BA327” },
{ text: “1 en 10.000”, color: “#569117” }
]
};
function drawElements() {
annotationsContainer.selectAll(‘*’).remove();
riskLegendContainer.selectAll(‘*’).remove();
const mapImageNode = mapImageVanessa.node();
const refElement = mapImageNode.complete ? mapImageNode : mapContainer.node();
const containerWidth = refElement.offsetWidth;
const containerHeight = refElement.offsetHeight;
if (containerWidth === 0 || containerHeight === 0) {
console.warn(“Container dimensions are zero. Cannot draw elements yet.”);
return;
}
const imageWidth = mapImageNode.offsetWidth;
const scaleLineWidth = imageWidth * 0.245;
scaleLine.style(‘width’, `${scaleLineWidth}px`);
const annotations = annotationsContainer.selectAll(‘.cardinal-vanessa-annotation’)
.data(annotationsData)
.enter()
.append(‘div’)
.attr(‘class’, ‘cardinal-vanessa-annotation’)
.each(function(d) {
const isMobile = window.innerWidth d.text);
const arrowSvg = annotationsContainer.append(‘svg’)
.style(‘position’, ‘absolute’)
.style(‘top’, ‘0’)
.style(‘left’, ‘0’)
.style(‘width’, ‘100%’)
.style(‘height’, ‘100%’)
.style(‘pointer-events’, ‘none’)
.style(‘z-index’, ‘5’)
.attr(‘viewBox’, `0 0 ${containerWidth} ${containerHeight}`)
.style(‘overflow’, ‘visible’);
const defs = arrowSvg.append(‘defs’);
defs.append(‘marker’)
.attr(‘id’, ‘arrowheadVanessa’)
.attr(‘markerWidth’, ‘7’)
.attr(‘markerHeight’, ‘5’)
.attr(‘refX’, ‘6’)
.attr(‘refY’, ‘2.5’)
.attr(‘orient’, ‘auto-start-reverse’)
.append(‘polygon’)
.attr(‘points’, ‘0 0, 7 2.5, 0 5’)
.attr(‘fill’, ‘white’)
.attr(‘filter’, ‘drop-shadow(1px 1px 1px rgba(0,0,0,0.7))’);
annotations.each(function(d) {
if (d.arrowOrigin && d.arrowEnd) {
const textElement = this;
const textRect = textElement.getBoundingClientRect();
const containerRect = mapContainer.node().getBoundingClientRect();
const textTopRel = textRect.top – containerRect.top;
const textLeftRel = textRect.left – containerRect.left;
const textWidth = textElement.offsetWidth;
const textHeight = textElement.offsetHeight;
let startX, startY;
const offset = 5;
if (d.arrowOrigin === ‘bottom’) {
startX = textLeftRel + textWidth / 2;
startY = textTopRel + textHeight + offset;
} else {
startX = textLeftRel + textWidth / 2;
startY = textTopRel – offset;
}
const endX = (d.arrowEnd.x / 100) * containerWidth;
const endY = (d.arrowEnd.y / 100) * containerHeight;
const midX = (startX + endX) / 2;
const midY = (startY + endY) / 2;
const vecX = endX – startX;
const vecY = endY – startY;
const dist = Math.sqrt(vecX * vecX + vecY * vecY);
const perpX = -vecY;
const perpY = vecX;
const perpLength = Math.max(Math.sqrt(perpX * perpX + perpY * perpY), 0.1);
const normPerpX = perpX / perpLength;
const normPerpY = perpY / perpLength;
const curveAmount = Math.max(dist * 0.25, 10);
const controlX = midX + normPerpX * curveAmount;
const controlY = midY + normPerpY * curveAmount;
arrowSvg.append(‘path’)
.attr(‘d’, `M ${startX} ${startY} Q ${controlX} ${controlY} ${endX} ${endY}`)
.attr(‘fill’, ‘none’)
.attr(‘stroke’, ‘white’)
.attr(‘stroke-width’, ‘2’)
.attr(‘stroke-linecap’, ’round’)
.attr(‘filter’, ‘drop-shadow(1px 1px 1px rgba(0,0,0,0.7))’)
.attr(‘marker-end’, ‘url(#arrowheadVanessa)’);
}
});
riskLegendContainer.append(‘div’)
.attr(‘class’, ‘cardinal-vanessa-risk-title’)
.text(riskLegendData.title);
const scaleContainer = riskLegendContainer.append(‘div’)
.attr(‘class’, ‘cardinal-vanessa-risk-scale’);
const riskLevels = scaleContainer.selectAll(‘.cardinal-vanessa-risk-level’)
.data(riskLegendData.levels)
.enter()
.append(‘div’)
.attr(‘class’, ‘cardinal-vanessa-risk-level’);
riskLevels.append(‘div’)
.attr(‘class’, ‘cardinal-vanessa-risk-color’)
.style(‘background-color’, d => d.color);
riskLevels.append(‘div’)
.text(d => d.text);
}
const mapImageNode = mapImageVanessa.node();
if (mapImageNode.complete && mapImageNode.naturalWidth > 0) {
drawElements();
} else {
mapImageVanessa.on(‘load’, drawElements);
mapImageVanessa.on(‘error’, () => {
console.error(“Map image failed to load.”);
});
}
let resizeTimer;
d3.select(window).on(‘resize’, () => {
clearTimeout(resizeTimer);
resizeTimer = setTimeout(drawElements, 250);
});
});
La EPA nunca ha sido muy clara sobre el nivel de riesgo de cáncer que considera aceptable para la población. En cambio, ha utilizado «puntos de referencia» de riesgo para guiar las decisiones sobre la autorización de nuevas fuentes de contaminación cerca de las comunidades. El límite inferior de este espectro de riesgos es 1 en 1 millón, un nivel por encima del cual la agencia ha dicho que se esfuerza por proteger al mayor número posible de personas. En el extremo superior del espectro está 1 entre 10.000 —un nivel que los expertos en salud pública han argumentado durante mucho tiempo que es demasiado permisivo, ya que el riesgo de cáncer de una persona por exposición a la contaminación se acumula al riesgo de cáncer que ya tiene por factores genéticos y ambientales. El riesgo para Domínguez y su familia es incluso mayor.
Según los resultados del modelizador del aire, 603.000 residentes de El Paso, aproximadamente el 90% de la población de la ciudad, están expuestos a un riesgo de cáncer superior a 1 en 1 millón sólo por los dos almacenes de Cardinal Health. Más de 1.600 personas, incluidos muchos vecinos de Domínguez, están expuestas a niveles superiores al umbral de aceptabilidad de la EPA de 1 entre 10.000. El análisis también estimó que el riesgo del almacén de Cardinal Health es mayor que el de una instalación de esterilización médica de Sterigenics, situada a apenas 35 millas en Santa Teresa, Nuevo México. Estos resultados subrayan la cantidad de óxido de etileno que puede acumularse en el aire simplemente por la liberación de gases. Grist proporcionó estos resultados a Cardinal Health, la TCEQ y la EPA. Ninguno de ellos respondió específicamente a las preguntas sobre estos hallazgos.
.cardinal-butterfield-container {
max-width: 1200px;
margin-top: 25px;
padding: 0;
font-family: ‘Basis Grotesque’, Arial, sans-serif;
overflow-x: hidden;
}
.cardinal-butterfield-container * {
box-sizing: border-box;
}
.cardinal-butterfield-map-container {
position: relative;
width: 100%;
margin-bottom: 10px;
}
.cardinal-butterfield-map-image {
width: 100%;
height: auto;
display: block;
}
.cardinal-butterfield-annotation {
position: absolute;
pointer-events: none;
z-index: 10;
}
.cardinal-butterfield-annotation-text {
color: white;
font-size: 16px;
text-shadow: 1px 1px 3px rgba(0, 0, 0, 0.8);
white-space: normal;
max-width: 150px;
line-height: 1.2;
}
.cardinal-butterfield-arrow {
position: absolute;
z-index: 5;
}
.cardinal-butterfield-scale-bar {
position: absolute;
bottom: 20px;
right: 20px;
color: white;
font-size: 14px;
text-shadow: 1px 1px 3px rgba(0, 0, 0, 0.8);
display: flex;
flex-direction: column;
align-items: flex-end;
}
.cardinal-butterfield-scale-line {
height: 2px;
background-color: white;
margin-top: 2px;
box-shadow: 1px 1px 3px rgba(0, 0, 0, 0.8);
}
.cardinal-butterfield-map-footer {
display: flex;
justify-content: space-between;
align-items: flex-end;
width: 100%;
}
.cardinal-butterfield-source-container {
color: #3c3830;
font-size: 12px;
text-align: left;
font-style: italic;
font-weight: bold;
}
.cardinal-butterfield-source-line {
margin-bottom: 3px;
}
.cardinal-butterfield-risk-legend {
color: #3c3830;
display: flex;
flex-direction: column;
align-items: flex-end;
}
.cardinal-butterfield-risk-title {
font-size: 14px;
text-align: right;
margin-bottom: 5px;
}
.cardinal-butterfield-risk-scale {
display: flex;
justify-content: flex-end;
align-items: flex-start;
margin-top: 5px;
width: auto;
}
.cardinal-butterfield-risk-level {
text-align: center;
font-size: 10px;
width: 40px;
margin-left: 0;
}
.cardinal-butterfield-risk-color {
width: 100%;
height: 20px;
display: block;
margin-bottom: 3px;
border-top: 1px solid #3c3830;
border-bottom: 1px solid #3c3830;
border-left: 1px solid #3c3830;
}
.cardinal-butterfield-risk-level:last-child .cardinal-butterfield-risk-color {
border-right: 1px solid #3c3830;
}
@media (max-width: 768px) {
.cardinal-butterfield-annotation-text {
font-size: 14px;
}
.cardinal-butterfield-map-footer {
flex-direction: row;
align-items: flex-end;
}
.cardinal-butterfield-source-container {
font-size: 10px;
text-align: left;
flex-basis: 40%;
max-width: 40%;
}
.cardinal-butterfield-scale-bar {
font-size: 12px;
}
.cardinal-butterfield-risk-legend {
flex-grow: 1;
}
.cardinal-butterfield-risk-title {
font-size: 12px;
margin-bottom: 4px;
text-align: right;
}
.cardinal-butterfield-risk-scale {
flex-wrap: wrap;
justify-content: flex-end;
}
.cardinal-butterfield-risk-level {
font-size: 9px;
width: 35px;
margin-bottom: 5px;
}
.cardinal-butterfield-risk-color {
width: 100%;
height: 15px;
margin-bottom: 2px;
border-top: 1px solid #3c3830;
border-bottom: 1px solid #3c3830;
border-left: 1px solid #3c3830;
}
}

document.addEventListener(‘DOMContentLoaded’, function() {
const mapContainer = d3.select(‘.cardinal-butterfield-map-container’);
const annotationsContainer = d3.select(‘#annotationsButterfield’);
const mapImageButterfield = d3.select(‘#mapImageButterfield’);
const riskLegendContainer = d3.select(‘#riskLegendButterfield’);
const scaleLine = d3.select(‘.cardinal-butterfield-scale-line’);
const scaleText = d3.select(‘#scaleTextButterfield’);
const annotationsData = [
{
text: “Almacén de Cardinal Health en Butterfield Trail Blvd.”,
desktop: { position: { x: 29, y: 25 } },
mobile: { position: { x: 13, y: 15 } },
arrowOrigin: ‘bottom’,
arrowEnd: { x: 51, y: 48 }
}
];
const riskLegendData = {
title: “Riesgo de cáncer”,
levels: [
{ text: “1 en 1 millón”, color: “#D8CFD8” },
{ text: “”, color: “#B5BFBA” },
{ text: “1 en 100.000”, color: “#79AD72” },
{ text: “”, color: “#6BA327” },
{ text: “1 en 10.000”, color: “#569117” }
]
};
function drawElements() {
annotationsContainer.selectAll(‘*’).remove();
riskLegendContainer.selectAll(‘*’).remove();
const mapImageNode = mapImageButterfield.node();
const refElement = mapImageNode.complete ? mapImageNode : mapContainer.node();
const containerWidth = refElement.offsetWidth;
const containerHeight = refElement.offsetHeight;
if (containerWidth === 0 || containerHeight === 0) {
console.warn(“Container dimensions are zero. Cannot draw elements yet.”);
return;
}
const imageWidth = mapImageNode.offsetWidth;
const scaleLineWidth = imageWidth * 0.145;
scaleLine.style(‘width’, `${scaleLineWidth}px`);
const annotations = annotationsContainer.selectAll(‘.cardinal-butterfield-annotation’)
.data(annotationsData)
.enter()
.append(‘div’)
.attr(‘class’, ‘cardinal-butterfield-annotation’)
.each(function(d) {
const isMobile = window.innerWidth d.text);
const arrowSvg = annotationsContainer.append(‘svg’)
.style(‘position’, ‘absolute’)
.style(‘top’, ‘0’)
.style(‘left’, ‘0’)
.style(‘width’, ‘100%’)
.style(‘height’, ‘100%’)
.style(‘pointer-events’, ‘none’)
.style(‘z-index’, ‘5’)
.attr(‘viewBox’, `0 0 ${containerWidth} ${containerHeight}`)
.style(‘overflow’, ‘visible’);
const defs = arrowSvg.append(‘defs’);
defs.append(‘marker’)
.attr(‘id’, ‘arrowheadButterfield’)
.attr(‘markerWidth’, ‘7’)
.attr(‘markerHeight’, ‘5’)
.attr(‘refX’, ‘6’)
.attr(‘refY’, ‘2.5’)
.attr(‘orient’, ‘auto-start-reverse’)
.append(‘polygon’)
.attr(‘points’, ‘0 0, 7 2.5, 0 5’)
.attr(‘fill’, ‘white’)
.attr(‘filter’, ‘drop-shadow(1px 1px 1px rgba(0,0,0,0.7))’);
annotations.each(function(d) {
if (d.arrowOrigin && d.arrowEnd) {
const textElement = this;
const textRect = textElement.getBoundingClientRect();
const containerRect = mapContainer.node().getBoundingClientRect();
const textTopRel = textRect.top – containerRect.top;
const textLeftRel = textRect.left – containerRect.left;
const textWidth = textElement.offsetWidth;
const textHeight = textElement.offsetHeight;
let startX, startY;
const offset = 5;
if (d.arrowOrigin === ‘bottom’) {
startX = textLeftRel + textWidth / 2;
startY = textTopRel + textHeight + offset;
} else {
startX = textLeftRel + textWidth / 2;
startY = textTopRel – offset;
}
const endX = (d.arrowEnd.x / 100) * containerWidth;
const endY = (d.arrowEnd.y / 100) * containerHeight;
const midX = (startX + endX) / 2;
const midY = (startY + endY) / 2;
const vecX = endX – startX;
const vecY = endY – startY;
const dist = Math.sqrt(vecX * vecX + vecY * vecY);
const perpX = -vecY;
const perpY = vecX;
const perpLength = Math.max(Math.sqrt(perpX * perpX + perpY * perpY), 0.1);
const normPerpX = perpX / perpLength;
const normPerpY = perpY / perpLength;
const curveAmount = Math.max(dist * 0.25, 10);
const controlX = midX + normPerpX * curveAmount;
const controlY = midY + normPerpY * curveAmount;
arrowSvg.append(‘path’)
.attr(‘d’, `M ${startX} ${startY} Q ${controlX} ${controlY} ${endX} ${endY}`)
.attr(‘fill’, ‘none’)
.attr(‘stroke’, ‘white’)
.attr(‘stroke-width’, ‘2’)
.attr(‘stroke-linecap’, ’round’)
.attr(‘filter’, ‘drop-shadow(1px 1px 1px rgba(0,0,0,0.7))’)
.attr(‘marker-end’, ‘url(#arrowheadButterfield)’);
}
});
riskLegendContainer.append(‘div’)
.attr(‘class’, ‘cardinal-butterfield-risk-title’)
.text(riskLegendData.title);
const scaleContainer = riskLegendContainer.append(‘div’)
.attr(‘class’, ‘cardinal-butterfield-risk-scale’);
const riskLevels = scaleContainer.selectAll(‘.cardinal-butterfield-risk-level’)
.data(riskLegendData.levels)
.enter()
.append(‘div’)
.attr(‘class’, ‘cardinal-butterfield-risk-level’);
riskLevels.append(‘div’)
.attr(‘class’, ‘cardinal-butterfield-risk-color’)
.style(‘background-color’, d => d.color);
riskLevels.append(‘div’)
.text(d => d.text);
}
const mapImageNode = mapImageButterfield.node();
if (mapImageNode.complete && mapImageNode.naturalWidth > 0) {
drawElements();
} else {
mapImageButterfield.on(‘load’, drawElements);
mapImageButterfield.on(‘error’, () => {
console.error(“Map image failed to load.”);
});
}
let resizeTimer;
d3.select(window).on(‘resize’, () => {
clearTimeout(resizeTimer);
resizeTimer = setTimeout(drawElements, 250);
});
});
En 2021, Domínguez dio a luz a su segundo hijo y, en los años siguientes, tanto ella como sus hijos empezaron a sufrir problemas respiratorios. Su hijo pequeño, en particular, desarrolló graves problemas respiratorios, y un neumólogo le recetó un inhalador y medicamentos antialérgicos para ayudarle a respirar mejor. Su hija, ya adolescente, se quejaba de dolores de cabeza persistentes. Y ella también empezó a tener dolores de cabeza sinusales.
Mientras tanto, Cardinal Health estaba ampliando sus operaciones. En 2023, la empresa solicitó a la TCEQ una actualización de su permiso «lo antes posible». En el almacén al otro lado de la ciudad de donde vive Domínguez, la empresa pronto esperaba recibir casi cuatro veces más camiones que transportaban productos esterilizados —potencialmente hasta 10.000 camiones al año— y el aumento del tráfico de camiones «podría incrementar las emisiones potenciales» de óxido de etileno.
Cardinal se basó en el experimento de 2013 para estimar las emisiones de la instalación, simplemente multiplicando esa concentración por el nuevo número máximo de camiones que la instalación estaría autorizada a recibir. El cálculo aproximado llevó a la empresa a estimar que el almacén situado al otro lado de la ciudad de Domínguez aumentaría sus emisiones a 1.000 libras de la sustancia química al año.

Cardinal también calculó que el equipo médico emitiría 637 libras de óxido de etileno al año dentro del almacén. Sin embargo, alegó que esas emisiones son «de minimus», es decir, fuentes insignificantes de contaminación. Según la legislación del estado de Texas, las emisiones mínimas, como los vapores que pueden formarse en un armario de limpieza donde se almacenan disolventes o los gases producidos por el funcionamiento de aparatos de aire acondicionado o calefactores, pueden quedar excluidas de los permisos.
«A ver, si soy profesor de universidad, no quiero estar pensando en los compuestos orgánicos volátiles que salen de los marcadores con los que escribo en la pizarra», dijo Ron Sahu, ingeniero mecánico y consultor con décadas de experiencia trabajando con reguladores medioambientales estatales y federales y con operadores industriales. Sin embargo, las excepciones arriba, continuó Sahu, «no se pensaron para compuestos altamente tóxicos como el óxido de etileno».
Como exigen las normas de Texas, Cardinal estudió instalaciones de todo el país que emiten cantidades comparables de óxido de etileno e hizo un resumen de la tecnología que utilizan para reducir las emisiones. Dado el volumen de las emisiones del almacén, las instalaciones más análogas eran las propias esterilizadoras. La empresa encontró dos esterilizadoras en Texas que utilizan equipos capaces de reducir sus emisiones en un 99%.
Más de esta serie

Pero estas opciones, concluyó Cardinal, tenían un «coste excesivo» y las emisiones del almacén eran «muy bajas». En su lugar, la empresa dijo que simplemente «restringiría» el número de camiones que descargan productos esterilizados: sólo tres por hora y 10.000 al año. En otras palabras, ampliaría sus operaciones, pero de forma controlada, con el fin de evitar métodos probados para reducir las emisiones de óxido de etileno.
Grist envió a la TCEQ preguntas detalladas por escrito sobre los permisos que concedió a Cardinal. Aunque las preguntas se basaban en documentos que la agencia ya había hecho públicos, un portavoz requirió que Grist enviara una solicitud formal de acceso a los registros «debido al nivel de exigencia y a la cantidad de información técnica que solicita».
Finalmente, en 2023, la TCEQ concedió el nuevo permiso a Cardinal.
Al mismo tiempo que Cardinal Health ampliaba sus operaciones en Texas, la lucha por lograr una supervisión más estricta del óxido de etileno se extendía por todo el país. Individuos de Lakewood, Colorado, presentaron demandas privadas por daños sanitarios relacionados con la exposición al óxido de etileno; otros se unieron a demandas colectivas contra empresas de esterilización y la EPA.
Finalmente, en abril de 2023, la EPA propuso regulaciones largamente esperadas para reducir las emisiones de óxido de etileno de las esterilizadoras. Si bien el proyecto de norma abarcaba las emisiones de los centros de almacenamiento ubicados en las propias instalaciones, no incluía los almacenes externos. Tampoco se incluyeron en el proyecto de norma otras disposiciones que los defensores del medio ambiente esperaban, como el control obligatorio del aire en las proximidades de las instalaciones.
De acuerdo con el procedimiento estándar, la EPA abrió un periodo de 75 días para comentarios públicos y posibles revisiones del proyecto de norma. Earthjustice organizó una reunión de defensores comunitarios de todo el país para aumentar la presión sobre la agencia para que reforzara su propuesta. Residentes de California, Texas, Puerto Rico y otros lugares con instalaciones de esterilización pasaron dos días en Washington, D.C., haciendo peticiones a los miembros del Congreso, reuniéndose con la EPA y compartiendo sus historias de exposición.

Daniel Savery, un representante legislativo de Earthjustice que ayudó a organizar el evento, dijo a Grist que la reunión con la Oficina de Aire y Radiación de la EPA contó con una buena asistencia y que los líderes expresaron empatía por las historias que escucharon. Pero cuando la agencia publicó la norma definitiva en marzo de 2024, no se incluyeron ni los almacenes externos ni la vigilancia obligatoria del aire. La normativa hace referencia al problema de los almacenes externos e indica la intención de la agencia de recopilar información sobre ellos, un primer paso que Savery cree que no se habría incluido en la norma si no fuera por la presión de las reuniones de Washington. No obstante, añadió, la EPA debería haber recopilado información sobre los almacenes de suministros médicos hace mucho tiempo.
«Esta no es su primera vez en el ruedo», dijo Savery, aludiendo a los ocho años que los defensores llevan presionando a la agencia para que aborde la exposición al óxido de etileno desde que se determinó su alta toxicidad en 2016. La Oficina del Inspector General de la EPA, un organismo de control independiente de la agencia, había pedido a los reguladores federales ya en 2020 que hicieran un mejor trabajo informando al público sobre su exposición al óxido de etileno de la industria de la esterilización. «En gran parte, el país sigue con una venda en los ojos respecto a estas fuentes de emisiones», señaló Savery.

Los esfuerzos para frenar las emisiones de óxido de etileno parecen poco probables durante el segundo mandato del presidente Donald Trump. El nominado de Trump para dirigir la oficina de calidad del aire de la EPA, Aaron Szabo, fue cabildero de la industria de la esterilización, y la agencia hace poco pidió a las esterilizadoras que buscan una exención de las reglas de óxido de etileno que envíen sus peticiones a una dirección de correo electrónico dedicada al gobierno. Desde entonces, la administración de Trump también ha dicho en presentaciones judiciales que planea «revisar y reconsiderar» las normas para las empresas de esterilización.
Un portavoz de la EPA dijo que no pueden «hablar de las decisiones de la administración Biden-Harris» y citó la reciente decisión de la agencia de ofrecer exenciones a las esterilizadoras. El portavoz también se refirió a otra decisión de la EPA de regular el óxido de etileno como pesticida. Esa decisión «podría requerir un estudio específico para recopilar datos sobre la exposición de los trabajadores al EtO en dispositivos médicos fumigados», dijo el portavoz. Sin embargo, al igual que con la regla de las esterilizadoras, la administración de Trump también podría decidir rescindir la determinación de pesticidas.
«El óxido de etileno de estos almacenes simplemente no está regulado», dijo Sahu, el ingeniero mecánico. «No hay ningún control, así que todo acabará tarde o temprano en el aire ambiente».
El pasado agosto, una mañana nublada en el este de El Paso (Texas), cuando la mayoría de la gente apenas empezaba su día, los trabajadores de Cardinal Health estaban sentados en sus coches aparcados en una calle cerca del almacén, a tiro de piedra del patio trasero de Domínguez. Habiendo empezado sus turnos a las 5 de la mañana, todos estaban de descanso. Un joven trabajador hablaba con su novia. Otro miraba Facebook. Y otro comía Takis, manchándose los dedos de un rojo vivo.
Algunos de sus trabajos requieren mover palés del tamaño de un frigorífico llenos de dispositivos médicos esterilizados. Otros abren con mucho cuidado los palés envueltos en plástico, trasladan las cajas de cartón que contienen los kits médicos al interior del almacén y los vuelven a empaquetar para enviarlos en camiones a hospitales de todo el país. Lo hacen con guantes protectores, mascarillas básicas y redecillas para el pelo —precauciones que la empresa exige para garantizar la esterilidad de los equipos médicos, no la protección de los trabajadores.

Grist habló con varios de ellos mientras descansaban o salían de sus turnos. Aunque ninguno de los trabajadores quiso hablar con los reporteros de Grist de forma oficial, por miedo a represalias de su empleador, compartieron sus experiencias sobre el trabajo en el almacén. La mayoría no sabía que estaban expuestos al óxido de etileno. Algunos habían oído hablar del producto químico, pero desconocían su grado de exposición y los riesgos que entrañaba.
Grist también distribuyó folletos a los trabajadores y a los residentes cercanos explicando los riesgos de la exposición al óxido de etileno. Dos trabajadores llamaron a Grist utilizando el número de contacto del folleto y dijeron que habían desarrollado cánceres después de empezar a trabajar allí. Los tipos de cáncer que se les habían diagnosticado se han relacionado con la exposición al óxido de etileno.
Desde que se enteró de las emisiones del almacén, Domínguez dice que ahora se lo piensa dos veces antes de dejar jugar a su hijo pequeño en el patio trasero. «Estamos dentro de la casa la mayor parte del tiempo por esa razón», dijo.
Domínguez había estado considerando comprar la propiedad de su jefe, pero ahora el futuro de su familia en su casa es incierto.
Nota del editor: Earthjustice es anunciante de Grist. Los anunciantes no tienen ningún papel en las decisiones editoriales de Grist.
Creamos una guía informativa —disponible en inglés y español— en colaboración con organizaciones comunitarias, organizaciones sin fines de lucro y residentes que, durante años, han impulsado una mayor regulación del EtO. Este folleto contiene información sobre el EtO, así como maneras de lograr que los funcionarios públicos aborden el asunto de las emisiones, recursos legales de referencia y más. Puede verlo, descargarlo, imprimirlo y compartirlo.
Si usted es un periodista local o un miembro de la comunidad que quiere saber más sobre cómo investigamos este problema y los pasos a seguir para obtener más información sobre los almacenes en su zona, lea esto.
This story was originally published by Grist with the headline El eslabón no regulado de una cadena de suministro tóxica on Apr 16, 2025.
]]>
66319831
https://grist.org/looking-forward/meet-the-djs-spinning-earth-day-into-nightlife/
Wed, 16 Apr 2025 14:50:07 +0000
https://grist.org/?post_type=looking-forward&p=663297
<
The vision
“In the nightlife industry, the majority of the crowd is very young. Our crowd is the future. So it’s great to have them all together and be able to raise some more awareness.”
— Ruben Pariente Gromark of DJs for Climate Action
The spotlight
Next Tuesday, April 22, will mark the 55th anniversary of Earth Day, a celebration launched in 1970 to bring attention and grassroots energy to environmental issues. But the days that immediately follow it, April 23 through 27, will mark the eighth annual offering of a relatively under-the-radar series of climate events: Earth Night.
Organized by a small volunteer group called DJs for Climate Action, Earth Night is a global initiative that brings climate and environmental messages into dance halls, bars, clubs, and other nightlife venues.
The idea started with a campaign by producer and DJ Sam Posner (also known as Sammy Bananas). Around 2009, he launched a holiday fundraising campaign for DJs to buy carbon credits to offset the emissions of the frequent flights they take to work at parties and events all over the world.
“He sent it to me and I was like, ‘Oh, this is really interesting,’” said Eli Goldstein (Soul Clap), a fellow music artist who’s now the president of DJs for Climate Action. “At that time I was flying a lot, and it was the first time a light bulb went off, that there was a negative side of all the flying around the world DJing.” Taking a flight is one of the most carbon-intensive activities any individual can do — and as long-distance, often international travel is a routine part of many DJs’ jobs, they can rack up some high carbon footprints.
Goldstein had long been interested in environmental issues. He even sang at Earth Day celebrations as a schoolkid. When he encountered Posner’s carbon-credits campaign, he had what he described as “an epiphany” that living his dream as a DJ wasn’t fully in line with his environmental values.
The end-of-year fundraisers continued for several years, under the banner of DJs Against Climate Change, before the group decided it wanted to do something bigger. Focusing only on the carbon footprint of traveling felt like a missed opportunity to take advantage of the unique skills the artists had to bring to the movement.
“We realized we could be a lot more constructive, positive, by encouraging DJs to use our platforms to educate and encourage action around climate and the environment,” Goldstein said. They wanted to invite DJs to do what they do best — spin tunes at parties — while fostering a space for learning, community building, and fundraising for climate solutions, and also emphasizing a vision of low-waste, regenerative local events.

A photo from the first Earth Night event at House of Yes in Brooklyn, New York. Sam Posner
The fledgling group organized the first Earth Night event in 2018 at House of Yes, a funky performance venue in Brooklyn. In addition to spinning DJ sets, the crew handed out literature at the door, projected climate information on the walls, and raised money for the local nonprofit NYC Environmental Justice Alliance. Around 500 people attended. “The idea was just to create an opportunity for nightlife, to have a joyful moment to support and educate about climate,” Goldstein said.
The event expanded from there. In 2019, the team coordinated Earth Night events in seven cities around the world, raising over $10,000 for various climate charities.
In 2020, the group had planned to hold 50 events, honoring the 50th anniversary of Earth Day. All those plans were scuttled by the arrival of the COVID-19 pandemic — but like so many other organizations, DJs for Climate Action quickly pivoted to a virtual approach, which had the effect of bringing Earth Night to many more people. “We did a livestream with 100 DJs from around the world — every continent except Antarctica was represented,” Goldstein said. “Everybody just played one song, and it was like 20 hours long. It was really epic and amazing.”
As in-person partying gradually returned, the team decided to take a more decentralized approach. While a number of artists have been involved over the years, the core team behind DJs for Climate Action is just five people, and they quickly realized they couldn’t sustain all the coordination and support that would be required to scale up the global event. Instead, they created a toolkit for local organizers — DJs, venues, promoters, or really anyone interested in hosting an Earth Night event. It includes specific tips for sustainability, such as going plastic-free, booking local talent, featuring plant-based menus, and using renewable energy where possible.

A photo from the second year of Earth Night at House of Yes, in 2019. Courtesy of DJs for Climate Action
For 2025, there are close to 40 events planned around the world, which will be added to the DJs for Climate Action website and Instagram in the coming days.
“It’s definitely taking on a life of its own,” Goldstein said. DJs for Climate Action also recently acquired formal nonprofit status and will be fundraising for itself through Earth Night as well, with a goal of expanding the organization’s capacity. “We’re now trying to raise money to have a more permanent team,” Goldstein said. “So we do encourage events to donate at least partially to DJs for Climate Action — but also to local climate and environmental justice orgs. Part of the beauty of Earth Night is it’s this local organizing, but still global energy, global community, global impact.”
Mónica Medina, a biology professor at Penn State, is organizing an event this year in State College, Pennsylvania. Although she’s not a frequenter of the club scene herself, State College is a party town, she said. She saw an opportunity to reach people with a climate message through a medium that she herself has found very healing: music.
“I feel that we have split our lives into so many bubbles that don’t overlap. But I feel that knowledge, spirituality, and fun can be together — and that music especially has the power of getting people entranced in a way where they are connected with these powerful lyrics,” she said.
That sentiment was echoed by Gui Becker, a fellow professor and musician who will be performing live at the State College event. Becker was in a metal band with his cousins when he was young, and his music evolved to explore environmental and climate justice themes as he studied biology in grad school. Over the past several years, he’s written a handful of hard rock songs with climate messages, and he’s collaborated with other scientists and musicians through an initiative called Science Strings.
“Music is so powerful,” said Becker, who’s looking forward to performing live at Manny’s, a popular all-ages venue in State College. “I think maybe we’re going to be able to reach an audience that normally doesn’t listen to environmental music, environmentally charged songs.”
In addition to Becker’s performance, the State College event on April 24 will include a DJ set by the venue’s owner and the premiere of a new music video that Medina and her students produced for “La Extinción,” a song by the Colombian musician Pernett.
At this year’s Earth Night event in Paris, on April 26, the music itself will have less of an explicit climate message — but the party will include a guided meditation by sound artist Lola Villa, featuring nature sounds that she recorded in the Amazon, as well as a panel featuring the event’s DJs on how artists can get involved in activism. The attendees will also get compostable wristbands — and in the 10 seconds it takes to put a wristband on, the venue staff will briefly explain to people why they’re there.
“I do believe that makes a big difference,” said Ruben Pariente Gromark (also known as Michel D.), a core member of DJs for Climate Action and the organizer of the Paris party. “As it’s a classic club venue where there’s parties every weekend, quite a few people might just come randomly, to go to a party where they’re used to going for a party. And then they will know that it’s a different [mission-driven] party.”
The wristbands will also feature a QR code that leads to a survey asking attendees how they traveled to the Earth Night event (walking, biking, driving, or even flying from afar). It’s part of a broader impact assessment the team intends to compile this year to measure the sustainability of the events.
At the end of the day, though, Earth Night is less about reducing the plastic cups at bars or the miles traveled to concert venues, and more about creating a joyful space for people to learn and get inspired to take action for the climate.
“When we talk about the climate crisis, environmental action, all these subjects — it’s full of anxiety, it’s very dark,” said Pariente Gromark. Although its festivities may take place under cover of darkness, Earth Night offers a counter to that doom-and-gloom narrative. Organizers hope the good vibes spread at the events will empower both artists and community members to lean further into climate work where they live — and even where they party.
“Climate change is such a global, overwhelming problem that can make us feel super powerless when we look at the macro scale,” Goldstein said. “When we look at our local community and how we can participate, help build resiliency, and just come together in a joyful way, it can feel like you’re actually making a difference.”
— Claire Elise Thompson
More exposure
- Read: about the strong climate and environmental justice themes that have long existed in hip hop (Grist)
- Read: about the cathartic power of Indigenous heavy metal (Grist)
- Read: about the pop band AJR and its efforts to get fans and concertgoers to take action for the climate (NPR)
- Read: about The Climate Soundtrack, a 41-track compilation produced by DJs for Climate Action, drawing on field recordings from Greenpeace’s sound library (Ableton) — and check out the soundtrack
- Listen: to a climate playlist that professor Medina has been compiling and using in her classroom
- Listen: to our Looking Forward playlist, compiled by you, dear readers!
A parting shot
Check out this solar-powered DJ booth — a focal point of the 2019 Earth Night event in Paris.

This story was originally published by Grist with the headline Meet the DJs spinning Earth Day into nightlife on Apr 16, 2025.
]]>
6632979
https://grist.org/accountability/is-your-community-at-risk-eto/
Wed, 16 Apr 2025 08:45:00 +0000
https://grist.org/?p=662403
<![CDATA[
How this story came about
When Grist reporters began talking to environmental advocates about ethylene oxide in 2023, we repeatedly heard that warehouses were a threat and that neither regulators nor community activists had any idea where they were. The advocates emphasized that, even as the Environmental Protection Agency was cracking down on emissions from sterilization facilities, it was overlooking warehouses. No one knew exactly how many of these warehouses existed, where they were located, or how much ethylene oxide they emitted. Ethylene oxide is a highly toxic substance, so we were taken aback by how little was known. We decided to try to fill in those gaps.
What we found
We found that two Cardinal Health warehouses in El Paso, Texas, likely pose a greater threat than a sterilization facility nearby. The emissions were resulting in additional cancer risk for a neighboring community that is higher than allowed by the EPA. We also identified about 30 other warehouses that emit ethylene oxide across the country. They are used by companies such as Boston Scientific, ConMed, and Becton Dickinson, as well as Cardinal Health. And they are not restricted to industrial parts of towns — they are near schools and playgrounds, gyms and apartment complexes.
From the outside, the warehouses do not attract attention. They look like any other distribution center. Many occupy hundreds of thousands of square feet, and dozens of trucks pull in and out every day. But when medical products are loaded, unloaded, and moved from these facilities, they belch ethylene oxide into the air. Most nearby residents have no idea that the nondescript buildings are a source of toxic pollution. Neither do most truck drivers, who are often hired on a contract basis, or many of the workers employed at the warehouses.
When Grist reported on the Cardinal Health warehouses in El Paso, our reporters handed out flyers to residents and workers so they could learn more and contact us. They’re available to view and download below:
How we identified the warehouses
The first list of roughly 30 warehouses primarily includes facilities that have reported ethylene oxide emissions to either the EPA or South Coast Air Quality Management District. We obtained these addresses by submitting public records requests to the agencies. We also identified a few warehouses on this list by speaking with truck drivers transporting medical devices from sterilization facilities to warehouses.
The second list consists of warehouses that are owned or operated by some of the nation’s major medical device manufacturers. Since we had a list of 30 warehouses we know emit ethylene oxide, we identified the medical device manufacturers and distributors utilizing those warehouses for storage. We then expanded the search to all warehouses used by those companies. To be clear, there is no evidence to suggest that every warehouse on the second list emits ethylene oxide. Instead, they are being presented for further research by local reporters and concerned citizens.
.eto-national-map {
–color-primary: #3c3830;
–color-secondary: #dfdfdf;
–color-tertiary: #ccc;
–color-background: #F0F0F0;
–typography-primary: “PolySans”, sans-serif;
–typography-secondary: “Basis Grotesque”, sans-serif;
–color-confirmed: #638d09;
–color-potential: #1d2903;
–color-graticule: #ccc;
–color-country-stroke: #ffffff;
–color-country-fill: rgba(60, 56, 48, 0.8);
–color-user-location: #007bff;
font-family: var(–typography-secondary);
margin: 0;
padding: 0;
position: relative;
width: 100%;
margin-bottom: 2rem;
box-sizing: border-box;
}
.eto-national-map * {
box-sizing: border-box;
}
.eto-national-map__container {
position: relative;
width: 66.666vw;
left: 50%;
transform: translateX(-50%);
margin-top: 2rem;
min-width: 320px;
box-sizing: border-box;
}
.eto-national-map__title {
margin: 0;
padding: 20px 0 5px;
font-size: 1.5rem;
text-align: left;
font-family: var(–typography-primary);
font-weight: normal;
}
.eto-national-map__subhed {
margin: 0 0 15px;
padding: 0;
font-size: 1rem;
text-align: left;
font-family: var(–typography-secondary);
font-weight: normal;
color: var(–color-primary);
line-height: 1.2;
}
.eto-national-map__search-container {
margin: 20px 0;
display: flex;
gap: 5px;
align-items: stretch;
flex-wrap: nowrap;
}
.eto-national-map__search-input {
flex-grow: 1;
padding: 8px 12px;
border: 1px solid var(–color-tertiary);
border-radius: 4px;
font-size: 14px;
font-family: var(–typography-secondary);
width: 100%;
}
.eto-national-map__search-button {
padding: 8px 15px;
background-color: var(–color-confirmed);
color: white;
border: none;
border-radius: 4px;
cursor: pointer;
font-size: 14px;
font-family: var(–typography-secondary);
transition: background-color 0.2s;
flex-shrink: 0;
width: auto;
line-height: normal;
}
.eto-national-map__search-button:hover {
background-color: #4a6a07;
}
.eto-national-map__search-results {
margin: 20px 0 40px;
font-size: 1rem;
font-style: normal;
color: var(–color-primary);
line-height: 1.2;
}
.eto-national-map__graticule {
fill: none;
stroke: var(–color-graticule);
stroke-width: 0.5px;
}
.eto-national-map__state {
fill: var(–color-country-fill);
}
.eto-national-map__state-borders {
fill: none;
stroke: var(–color-country-stroke);
stroke-width: 1.5px;
}
.eto-national-map__country-outline {
fill: none;
stroke: var(–color-primary);
stroke-width: 1px;
}
.eto-national-map__location-dot {
cursor: pointer;
transition: opacity 0.3s, r 0.3s;
}
.eto-national-map__location-dot.confirmed {
fill: var(–color-confirmed);
stroke: white;
stroke-width: 1px;
}
.eto-national-map__location-dot.potential {
fill: var(–color-potential);
stroke: white;
stroke-width: 1px;
}
.eto-national-map__tooltip {
position: absolute;
pointer-events: none;
background-color: rgba(255, 255, 255, 0.95);
color: var(–color-primary);
padding: 12px;
border-radius: 4px;
font-size: 12px;
z-index: 999;
opacity: 0;
transition: opacity 0.3s;
box-shadow: 0 2px 10px rgba(0, 0, 0, 0.15);
max-width: 300px;
border: 1px solid var(–color-tertiary);
}
.eto-national-map__tooltip.visible {
opacity: 1;
transform: translateY(0);
}
.eto-national-map__tooltip h3 {
margin: 0 0 8px 0;
padding-bottom: 6px;
border-bottom: 1px solid var(–color-tertiary);
font-size: 14px;
}
.eto-national-map__tooltip p {
margin: 3px 0;
font-size: 12px;
}
.eto-national-map__loading {
position: absolute;
top: 50%;
left: 50%;
transform: translate(-50%, -50%);
font-size: 18px;
color: var(–color-primary);
}
.eto-national-map__legend {
margin-top: 10px;
display: flex;
justify-content: center;
gap: 20px;
font-size: 1rem;
font-family: var(–typography-secondary);
margin-bottom: 10px;
}
.eto-national-map__legend-item {
display: flex;
align-items: center;
gap: 5px;
}
.eto-national-map__legend-dot {
width: 12px;
height: 12px;
border-radius: 50%;
stroke: white;
stroke-width: 1px;
}
.eto-national-map__legend-dot.confirmed {
background-color: var(–color-confirmed);
}
.eto-national-map__legend-dot.potential {
background-color: var(–color-potential);
}
.eto-national-map__puerto-rico-container {
position: absolute;
bottom: 5px;
right: 20px;
width: 150px;
height: 100px;
border: 1px solid var(–color-tertiary);
background-color: #f0f0f0;
border-radius: 4px;
overflow: hidden;
box-shadow: 0 2px 5px rgba(0, 0, 0, 0.1);
}
.eto-national-map__zoom-controls {
position: absolute;
bottom: 115px;
right: 20px;
display: flex;
flex-direction: column;
gap: 5px;
z-index: 10;
}
.eto-national-map__zoom-button {
width: 30px;
height: 30px;
background-color: #f0f0f0;
border: 1px solid var(–color-tertiary);
border-radius: 4px;
font-size: 18px;
font-weight: bold;
color: #3c3830;
cursor: pointer;
display: flex;
align-items: center;
justify-content: center;
box-shadow: 0 1px 3px rgba(0, 0, 0, 0.1);
transition: background-color 0.2s;
}
.eto-national-map__zoom-button:hover {
background-color: rgba(255, 255, 255, 1);
}
.eto-national-map__reset-button {
width: 30px;
height: 30px;
background-color: #f0f0f0;
border: 1px solid var(–color-tertiary);
border-radius: 4px;
font-size: 14px;
font-weight: normal;
color: #3c3830;
cursor: pointer;
display: flex;
align-items: center;
justify-content: center;
box-shadow: 0 1px 3px rgba(0, 0, 0, 0.1);
transition: background-color 0.2s;
padding: 0;
}
.eto-national-map__reset-button:hover {
background-color: rgba(255, 255, 255, 1);
}
.eto-national-map__pr-label {
font-size: 10px;
font-family: var(–typography-secondary);
fill: #f0f0f0;
text-anchor: middle;
text-transform: uppercase;
}
.eto-national-map__source {
color: #3c3830;
font-size: 12px;
text-align: left;
font-style: italic;
font-weight: bold;
margin-top: 5px;
padding-right: 0;
max-width: 60%;
}
.eto-national-map__source a {
text-decoration: underline;
}
@media (max-width: 768px) {
.eto-national-map {
width: 100%;
margin: 0;
}
.eto-national-map__container {
position: relative;
width: 100%;
max-width: none;
left: 0;
transform: none;
margin: 0;
padding: 0 1rem;
min-width: 0;
}
.eto-national-map__tooltip {
max-width: 260px;
padding: 14px;
font-size: 14px;
box-shadow: 0 4px 15px rgba(0, 0, 0, 0.2);
border: 1px solid var(–color-graticule);
background-color: rgba(255, 255, 255, 0.98);
}
.eto-national-map__tooltip p {
font-size: 14px !important;
margin: 5px 0 !important;
}
.eto-national-map__tooltip h3 {
font-size: 16px !important;
}
.eto-national-map__puerto-rico-container {
width: 120px;
height: 80px;
bottom: 2px;
right: 10px;
}
.eto-national-map__zoom-controls {
bottom: 95px;
right: 10px;
}
.eto-national-map__source {
font-size: 10px;
text-align: left;
padding-right: 10px;
max-width: 60%;
}
.eto-national-map__pr-label {
font-size: 8px;
}
.eto-national-map__search-container {
flex-direction: column;
align-items: stretch;
max-width: none;
}
.eto-national-map__search-input {
font-size: 16px;
}
.eto-national-map__search-button {
font-size: 16px;
padding: 10px 15px;
}
.eto-national-map__search-results {
font-size: 1rem;
}
}
.eto-national-map__suggestions-container {
position: relative;
flex-grow: 1;
}
.eto-national-map__suggestions-list {
position: absolute;
background-color: white;
border: 1px solid var(–color-tertiary);
border-top: none;
border-radius: 0 0 4px 4px;
list-style: none;
margin: 0;
padding: 0;
width: 100%;
max-height: 200px;
overflow-y: auto;
z-index: 1000;
box-shadow: 0 4px 6px rgba(0, 0, 0, 0.1);
display: none;
}
.eto-national-map__suggestions-list.visible {
display: block;
}
.eto-national-map__suggestions-item {
padding: 8px 12px;
cursor: pointer;
font-size: 13px;
border-bottom: 1px solid var(–color-secondary);
}
.eto-national-map__suggestions-item:last-child {
border-bottom: none;
}
.eto-national-map__suggestions-item:hover {
background-color: var(–color-background);
}
Warehouses storing products sterilized with ethylene oxide
Grist assembled a list of U.S. warehouses that have reported storing products sterilized with ethylene oxide and others used by major medical device manufacturers and distributors.
Confirmed
Potential
let mapInitialized = false; // Flag to prevent multiple initializations
function initMap() {
if (mapInitialized) return; // Exit if already initialized
if (typeof d3 === ‘undefined’ || typeof topojson === ‘undefined’) {
setTimeout(initMap, 100);
return;
}
mapInitialized = true; // Set flag after dependency check
document.addEventListener(‘touchstart’, function(event) {
const tooltip = document.getElementById(‘tooltip’);
const target = event.target;
if (!target.classList.contains(‘eto-national-map__location-dot’) && tooltip) {
hideTooltip();
}
}, { passive: false });
document.addEventListener(‘click’, function(event) {
const tooltip = document.getElementById(‘tooltip’);
const target = event.target;
if (!target.classList.contains(‘eto-national-map__location-dot’) && tooltip) {
hideTooltip();
}
});
const width = 1000;
const height = 600;
const margin = { top: 10, right: 20, bottom: 40, left: 20 };
const svg = d3.select(“#map”).append(“svg”)
.attr(“width”, “100%”)
.attr(“height”, “100%”)
.attr(“viewBox”, `0 0 ${width} ${height}`)
.attr(“preserveAspectRatio”, “xMidYMid meet”)
.style(“max-width”, “100%”)
.style(“height”, “auto”);
const defs = svg.append(“defs”);
const filter = defs.append(“filter”)
.attr(“id”, “drop-shadow”)
.attr(“height”, “130%”);
filter.append(“feGaussianBlur”)
.attr(“in”, “SourceAlpha”)
.attr(“stdDeviation”, 3)
.attr(“result”, “blur”);
filter.append(“feOffset”)
.attr(“in”, “blur”)
.attr(“dx”, 2)
.attr(“dy”, 2)
.attr(“result”, “offsetBlur”);
filter.append(“feFlood”)
.attr(“flood-color”, “#3c3830”)
.attr(“flood-opacity”, 0.3)
.attr(“result”, “offsetColor”);
filter.append(“feComposite”)
.attr(“in”, “offsetColor”)
.attr(“in2”, “offsetBlur”)
.attr(“operator”, “in”)
.attr(“result”, “offsetBlur”);
const feMerge = filter.append(“feMerge”);
feMerge.append(“feMergeNode”)
.attr(“in”, “offsetBlur”)
feMerge.append(“feMergeNode”)
.attr(“in”, “SourceGraphic”);
const prContainer = d3.select(“#map”).append(“div”)
.attr(“class”, “eto-national-map__puerto-rico-container”);
const prSvg = prContainer.append(“svg”)
.attr(“width”, “100%”)
.attr(“height”, “100%”)
.attr(“viewBox”, “0 0 150 100”)
.attr(“preserveAspectRatio”, “xMidYMid meet”);
const tooltip = d3.select(“#tooltip”);
const projection = d3.geoAlbersUsa()
.scale(1200)
.translate([width / 2, height / 2]);
const prProjection = d3.geoMercator()
.center([-66.5, 18.2])
.scale(4000)
.translate([75, 50]);
const path = d3.geoPath().projection(projection);
const prPath = d3.geoPath().projection(prProjection);
const g = svg.append(“g”);
const baseDotRadius = 9;
const baseStrokeWidth = 1;
const prBaseDotRadius = 6;
async function loadData() {
try {
const csvData = await d3.csv(“https://raw.githubusercontent.com/Grist-Data-Desk/eto-warehouses/refs/heads/main/eto-warehouses.csv”);
return csvData.map(d => ({
company: d.Company,
address: d[“Warehouse Address”],
state: d.State,
source: d.Source,
type: d.Type,
latitude: +d.Latitude,
longitude: +d.Longitude
}));
} catch (error) {
console.error(“Error loading CSV data:”, error);
return [];
}
}
async function drawMap() {
try {
const us = await d3.json(“https://cdn.jsdelivr.net/npm/us-atlas@3/states-10m.json”);
const warehouseData = await loadData();
d3.select(“.eto-national-map__loading”).remove();
const states = topojson.feature(us, us.objects.states);
const statesMesh = topojson.mesh(us, us.objects.states);
g.append(“g”)
.attr(“filter”, “url(#drop-shadow)”)
.selectAll(“path”)
.data(states.features)
.enter().append(“path”)
.attr(“class”, “eto-national-map__state”)
.attr(“d”, path);
g.append(“path”)
.datum(statesMesh)
.attr(“class”, “eto-national-map__state-borders”)
.attr(“d”, path);
g.append(“path”)
.datum(topojson.mesh(us, us.objects.states, (a, b) => a === b))
.attr(“class”, “eto-national-map__country-outline”)
.attr(“d”, path);
const puertoRico = us.objects.states.geometries.find(d => d.id === “72”);
if (puertoRico) {
const prFeature = topojson.feature(us, {
type: “GeometryCollection”,
geometries: [puertoRico]
});
prSvg.append(“g”)
.selectAll(“path”)
.data(prFeature.features)
.enter().append(“path”)
.attr(“class”, “eto-national-map__state”)
.attr(“d”, prPath);
prSvg.append(“path”)
.datum(prFeature)
.attr(“class”, “eto-national-map__country-outline”)
.attr(“d”, prPath);
prSvg.append(“text”)
.attr(“class”, “eto-national-map__pr-label”)
.attr(“x”, 75)
.attr(“y”, 51)
.text(“Puerto Rico”);
}
const mainlandPoints = warehouseData.filter(d =>
!isNaN(d.latitude) && !isNaN(d.longitude) &&
!(d.state === “PR” || d.state === “Puerto Rico”));
const puertoRicoPoints = warehouseData.filter(d =>
!isNaN(d.latitude) && !isNaN(d.longitude) &&
(d.state === “PR” || d.state === “Puerto Rico”));
g.selectAll(“.eto-national-map__location-dot.mainland”)
.data(mainlandPoints)
.enter()
.append(“circle”)
.attr(“class”, d => `eto-national-map__location-dot mainland ${d.type.toLowerCase() === “confirmed” ? “confirmed” : “potential”}`)
.attr(“cx”, d => {
const coords = projection([d.longitude, d.latitude]);
return coords ? coords[0] : null;
})
.attr(“cy”, d => {
const coords = projection([d.longitude, d.latitude]);
return coords ? coords[1] : null;
})
.attr(“r”, baseDotRadius)
.style(“stroke-width”, baseStrokeWidth)
.style(“opacity”, 0.8)
.on(“mouseover”, function(event, d) {
const currentScale = d3.zoomTransform(svg.node()).k || 1;
d3.select(this)
.transition()
.duration(200)
.attr(“r”, baseDotRadius * 1.3 / currentScale)
.style(“opacity”, 1);
showTooltip(event, d);
})
.on(“mouseout”, function() {
const currentScale = d3.zoomTransform(svg.node()).k || 1;
d3.select(this)
.transition()
.duration(200)
.attr(“r”, baseDotRadius / currentScale)
.style(“opacity”, 0.8);
hideTooltip();
})
.on(“touchstart”, function(event, d) {
event.preventDefault();
const wasVisible = tooltip.classed(“visible”);
hideTooltip();
const currentScale = d3.zoomTransform(svg.node()).k || 1;
d3.select(this)
.attr(“r”, wasVisible ? baseDotRadius / currentScale : baseDotRadius * 1.3 / currentScale)
.style(“opacity”, wasVisible ? 0.8 : 1);
if (!wasVisible) {
showTooltip(event.touches[0], d);
} else {
d3.select(this)
.transition()
.duration(200)
.attr(“r”, baseDotRadius / currentScale)
.style(“opacity”, 0.8);
}
});
prSvg.selectAll(“.eto-national-map__location-dot.puerto-rico”)
.data(puertoRicoPoints)
.enter()
.append(“circle”)
.attr(“class”, d => `eto-national-map__location-dot puerto-rico ${d.type.toLowerCase() === “confirmed” ? “confirmed” : “potential”}`)
.attr(“cx”, d => {
const coords = prProjection([d.longitude, d.latitude]);
return coords ? coords[0] : null;
})
.attr(“cy”, d => {
const coords = prProjection([d.longitude, d.latitude]);
return coords ? coords[1] : null;
})
.attr(“r”, prBaseDotRadius)
.style(“opacity”, 0.8)
.on(“mouseover”, function(event, d) {
d3.select(this)
.transition()
.duration(200)
.attr(“r”, prBaseDotRadius * 1.3)
.style(“opacity”, 1);
const rect = prSvg.node().getBoundingClientRect();
const evt = {
clientX: rect.left + parseFloat(d3.select(this).attr(“cx”)),
clientY: rect.top + parseFloat(d3.select(this).attr(“cy”))
};
showTooltip(evt, d);
})
.on(“mouseout”, function() {
d3.select(this)
.transition()
.duration(200)
.attr(“r”, prBaseDotRadius)
.style(“opacity”, 0.8);
hideTooltip();
})
.on(“touchstart”, function(event, d) {
event.preventDefault();
const wasVisible = tooltip.classed(“visible”);
hideTooltip();
if (!wasVisible) {
d3.select(this)
.transition()
.duration(200)
.attr(“r”, prBaseDotRadius * 1.3)
.style(“opacity”, 1);
const rect = prSvg.node().getBoundingClientRect();
const evt = {
clientX: rect.left + parseFloat(d3.select(this).attr(“cx”)),
clientY: rect.top + parseFloat(d3.select(this).attr(“cy”))
};
showTooltip(evt, d);
}
});
const zoom = d3.zoom()
.scaleExtent([1, 8])
.on(“zoom”, zoomed);
svg.call(zoom);
d3.select(“#zoom-in”).on(“click”, function() {
svg.transition().duration(300).call(zoom.scaleBy, 1.3);
});
d3.select(“#zoom-out”).on(“click”, function() {
svg.transition().duration(300).call(zoom.scaleBy, 1 / 1.3);
});
zoomed({ transform: d3.zoomIdentity });
const searchInput = d3.select(“#address-input”);
const searchButton = d3.select(“#search-button”);
const searchResults = d3.select(“#search-results”);
const suggestionsList = d3.select(“#search-suggestions”);
let currentSuggestions = [];
async function fetchSuggestions(query) {
if (!query || query.length 0) {
suggestions.forEach((item, index) => {
suggestionsList.append(“li”)
.attr(“class”, “eto-national-map__suggestions-item”)
.text(item.display_name)
.on(“click”, () => {
selectSuggestion(index);
});
});
suggestionsList.classed(“visible”, true);
} else {
hideSuggestions();
}
} else {
hideSuggestions();
}
}
function hideSuggestions() {
suggestionsList.classed(“visible”, false);
currentSuggestions = [];
}
function selectSuggestion(index) {
if (index = currentSuggestions.length) return;
const selected = currentSuggestions[index];
searchInput.property(“value”, selected.display_name);
hideSuggestions();
searchResults.text(“Processing selected location…”);
processSelectedLocation(selected);
}
async function handleSearch() {
const query = searchInput.property(“value”).trim();
hideSuggestions();
if (!query) {
searchResults.text(“Please enter an address or zip code.”);
return;
}
searchResults.text(“Searching…”);
removeUserMarker();
try {
const response = await fetch(`https://nominatim.openstreetmap.org/search?format=json&q=${encodeURIComponent(query)}&countrycodes=us,pr&limit=1`, {
headers: {
‘User-Agent’: ‘Grist EtO Warehouse Map/1.0 (contact: caldern@grist.org)’
}
});
if (!response.ok) throw new Error(`HTTP error! status: ${response.status}`);
const data = await response.json();
if (data && data.length > 0) {
processSelectedLocation(data[0]);
} else {
searchResults.text(“Address not found. Please try a different search.”);
}
} catch (error) {
console.error(“Error during geocoding search:”, error);
searchResults.text(“Error searching for address. Please try again later.”);
}
}
function processSelectedLocation(locationData) {
const userLat = parseFloat(locationData.lat);
const userLon = parseFloat(locationData.lon);
const displayName = locationData.display_name;
const userLocation = { longitude: userLon, latitude: userLat };
searchInput.property(“value”, displayName);
removeUserMarker();
addUserMarker(userLocation);
const coords = projection([userLon, userLat]);
let mapPanningMessage = “”;
if (coords) {
svg.transition().duration(750).call(
zoom.transform,
d3.zoomIdentity.translate(width / 2, height / 2).scale(4).translate(-coords[0], -coords[1])
);
} else {
mapPanningMessage = ” (Map panning only available for mainland US)”;
}
const nearest = findNearestWarehouse(userLocation, mainlandPoints.concat(puertoRicoPoints));
const locationSpan = `📍 `;
const warehouseSpan = `🚚 `;
let warehouseText = “No nearby warehouses found.”;
if (nearest) {
const distance = calculateDistance(userLat, userLon, nearest.warehouse.latitude, nearest.warehouse.longitude);
const warehouseType = nearest.warehouse.type.toLowerCase();
const warehouseName = nearest.warehouse.company;
warehouseText = `Nearest ${warehouseType} warehouse: ${warehouseName} (${distance.toFixed(1)} miles away)`;
highlightWarehouse(nearest.warehouse);
}
const locationString = `${locationSpan}Searched location: ${displayName}${mapPanningMessage}`;
const finalHtml = `${locationString}
${warehouseSpan}${warehouseText}`;
searchResults.html(finalHtml);
}
searchInput.on(“input”, function() {
const query = searchInput.property(“value”).trim();
fetchSuggestions(query).catch(error => console.error(“Error in fetchSuggestions call:”, error));
});
d3.select(document).on(“click”, function(event) {
const target = event.target;
const isInput = target === searchInput.node();
const isSuggestion = suggestionsList.node().contains(target);
if (!isInput && !isSuggestion) {
hideSuggestions();
}
});
searchButton.on(“click”, handleSearch);
searchInput.on(“keypress”, function(event) {
if (event.key === “Enter”) {
event.preventDefault();
handleSearch();
}
});
function calculateDistance(lat1, lon1, lat2, lon2) {
const R = 3958.8; // Radius of the Earth in miles
const dLat = (lat2 – lat1) * Math.PI / 180;
const dLon = (lon2 – lon1) * Math.PI / 180;
const a =
Math.sin(dLat / 2) * Math.sin(dLat / 2) +
Math.cos(lat1 * Math.PI / 180) * Math.cos(lat2 * Math.PI / 180) *
Math.sin(dLon / 2) * Math.sin(dLon / 2);
const c = 2 * Math.atan2(Math.sqrt(a), Math.sqrt(1 – a));
return R * c; // Distance in miles
}
function findNearestWarehouse(userLocation, warehouses) {
let minDistance = Infinity;
let nearestWarehouse = null;
warehouses.forEach(warehouse => {
if (!isNaN(warehouse.latitude) && !isNaN(warehouse.longitude)) {
const distance = calculateDistance(userLocation.latitude, userLocation.longitude, warehouse.latitude, warehouse.longitude);
if (distance d.company === warehouse.company && d.address === warehouse.address);
if (!dot.empty()) {
const currentScale = d3.zoomTransform(svg.node()).k || 1;
dot.raise()
.classed(“highlighted”, true)
.transition()
.duration(300)
.attr(“r”, baseDotRadius * 1.5 / currentScale)
.style(“stroke”, “var(–color-user-location)”)
.style(“stroke-width”, 2 / currentScale);
}
}
function resetMap() {
svg.transition().duration(750).call(zoom.transform, d3.zoomIdentity);
searchInput.property(“value”, “”);
searchResults.text(“”);
hideSuggestions();
removeUserMarker();
g.selectAll(“.eto-national-map__location-dot.highlighted”)
.classed(“highlighted”, false)
.transition()
.duration(200)
.style(“stroke”, “white”)
.attr(“r”, baseDotRadius / (d3.zoomTransform(svg.node()).k || 1))
.style(“stroke-width”, baseStrokeWidth / (d3.zoomTransform(svg.node()).k || 1));
}
d3.select(“#reset-view”).on(“click”, resetMap);
} catch (error) {
console.error(“Error drawing map:”, error);
d3.select(“.eto-national-map__loading”).text(“Error loading map data. Please try again later.”);
}
}
function zoomed(event) {
const { transform } = event;
g.attr(“transform”, transform);
g.selectAll(“.eto-national-map__location-dot.mainland”)
.attr(“r”, baseDotRadius / transform.k)
.style(“stroke-width”, baseStrokeWidth / transform.k);
g.selectAll(“.eto-national-map__state-borders”)
.style(“stroke-width”, baseStrokeWidth / transform.k);
g.selectAll(“.eto-national-map__country-outline”)
.style(“stroke-width”, baseStrokeWidth / transform.k);
g.select(“#user-location-marker”)
.attr(“r”, 8 / transform.k)
.attr(“stroke-width”, 1.5 / transform.k);
g.selectAll(“.eto-national-map__location-dot.highlighted”)
.attr(“r”, baseDotRadius * 1.5 / transform.k)
.style(“stroke-width”, 2 / transform.k);
}
function showTooltip(event, d) {
const mapContainer = document.querySelector(‘.eto-national-map__container’).getBoundingClientRect();
const tooltipWidth = window.innerWidth <= 768 ? 260 : 250;
const tooltipHeight = window.innerWidth mapContainer.width) {
tooltipX = mouseX – tooltipWidth – tooltipOffset;
}
if (tooltipY + tooltipHeight > mapContainer.height) {
tooltipY = mouseY – tooltipHeight – tooltipOffset;
}
tooltipX = Math.max(10, Math.min(mapContainer.width – tooltipWidth – 10, tooltipX));
tooltipY = Math.max(10, Math.min(mapContainer.height – tooltipHeight – 10, tooltipY));
const tooltipContent = `
${d.company}
Address: ${d.address}
State: ${d.state}
Status: ${d.type}
`;
tooltip
.style(“left”, `${tooltipX}px`)
.style(“top”, `${tooltipY}px`)
.html(tooltipContent)
.classed(“visible”, true)
.style(“opacity”, 1);
}
function hideTooltip() {
tooltip.classed(“visible”, false).style(“opacity”, 0);
}
drawMap();
}
if (document.readyState === ‘loading’) {
document.addEventListener(‘DOMContentLoaded’, initMap);
} else {
initMap();
}
How to find warehouses in your area
Look through the two lists we’ve compiled. Are any in your area Are there any companies that operate in your region or your state?
If you don’t find any warehouses in your region on our lists, make a list of the medical device companies and distributors in your state. The major companies we’ve come across in our research are Cardinal Health, Medline, and Owens & Minor. Then attempt to identify where they warehouse products. You can find this information by looking at:
The company’s website
Some companies list their facilities — including warehouses — in the “About Us” or “Locations” sections of their website. If the company maintains a jobs portal, look for any warehouse-related positions and whether it lists a location of employment.
SEC filings
If the company is publicly traded, it will need to submit financial information to the Securities and Exchange Commission. Search the SEC’s EDGAR database for the company’s filings. Sometimes, companies disclose their risk to litigation or regulation related to ethylene oxide. Some companies also list their assets, including facility locations, in these filings.
Google Maps
Search for a medical device company in your area. For instance, if you’re interested in Medline, you can try “Medline warehouse” or “Medline distribution center” and see if any come up near you.

If I’m a local reporter or a concerned resident, what can I do with this information now that I know where a warehouse is?
Once you’ve identified a warehouse that you suspect might store products sterilized with ethylene oxide, you can try to confirm whether it emits the chemical through one of these methods:
Submit records requests to local and state environmental agencies
Reach out to the city or state agency that permits air quality in your region. Often it’s the state department of environmental quality, but sometimes they can be regional air quality districts (like in California) or city environmental offices. Ask for all air quality permit applications submitted by the warehouse operator in question or all correspondence by the warehouse operator that mentions ethylene oxide.
Try to connect it to a sterilization facility
Products are first fumigated with ethylene oxide at sterilization facilities before being sent to warehouses for storage. If products are being delivered from a sterilizer to the warehouse you’re investigating, that’s a strong indicator that the warehouse emits some amount of ethylene oxide. There are two main approaches to take when trying to flesh out the supply chain to warehouses.
- Talk to the drivers dropping off at warehouses: You can try to determine where products are coming from by talking to the truck drivers delivering shipments to the warehouse.
- Talk to the drivers leaving sterilization facilities: There are fewer than 100 sterilization facilities in the country, and the EPA maintains a list of them here. If one is near you, you can ask drivers for information about where they are taking the products.
- Contact the company: Some companies have public relations or community engagement staff who respond to resident questions. Try reaching out to see if they’re open to talking to you.
Talk to workers
Try to speak with the warehouse workers while they’re on break or at the end of their shift. Companies are required to inform their workers about ethylene oxide exposure, so you could ask questions about whether they’ve been in any meetings where managers referenced exposure to a chemical. Even still, many workers aren’t aware that they’re being exposed to ethylene oxide. But ask them if the facility has air quality monitors, and if so, whether they know what it’s monitoring for.

If I’m a resident wanting to get involved but have no journalism experience, what can I do to get more information?
- Take a look at this 2023 map and report assessing 104 facilities that emit ethylene oxide by the Union of Concerned Scientists.
- Any member of the public can file a Freedom of Information Act, or FOIA, request to get public information from the federal government. You can also file an open records request to get information from local and state agencies. There are many resources to help you craft these:
– FOIA Wiki, made by Reporters Committee for Freedom of the Press
– The federal FOIA website
- Read our other stories to learn more details about ethylene oxide:
– ‘Dulce’: How a sweet-smelling chemical upended life in Salinas, Puerto Rico
– An invisible chemical is poisoning thousands of unsuspecting warehouse workers
This story was originally published by Grist with the headline Is your community at risk? How to access data and tell stories about EtO on Apr 16, 2025.
]]>
6624037
https://grist.org/accountability/su-comunidad-esta-en-riesgo-como-acceder-a-la-informacion-y-contar-historias-sobre-el-eto/
Wed, 16 Apr 2025 08:45:00 +0000
https://grist.org/?p=662522
<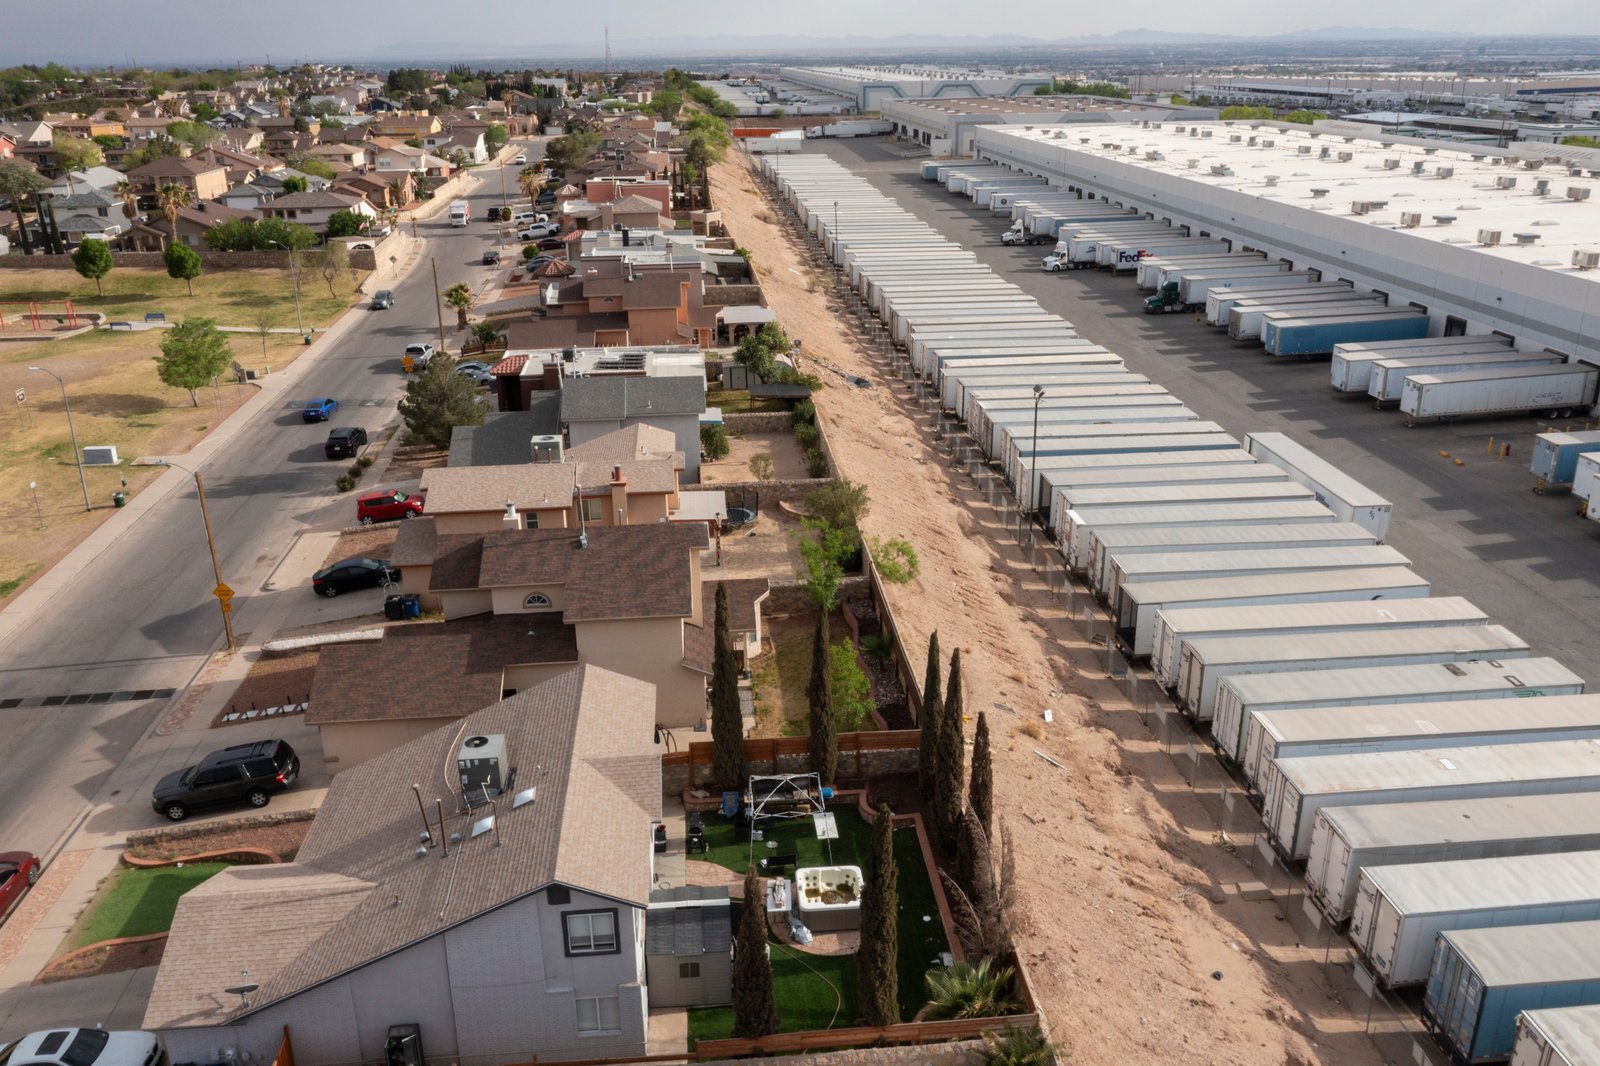
Nuestros hallazgos
Descubrimos que dos almacenes de Cardinal Health en El Paso, Texas, probablemente representan una amenaza mayor que un centro de esterilización cercano. Las emisiones generaban un riesgo adicional de cáncer para una comunidad vecina, superior al permitido por la EPA. También identificamos otros 30 almacenes que emiten óxido de etileno en todo el país. Son utilizados por compañías como Boston Scientific, ConMed y Becton Dickinson, así como por Cardinal Health. Y no se limitan a las zonas industriales de las ciudades —se ubican cerca de escuelas y parques infantiles, gimnasios y complejos de departamentos.
Desde afuera, los almacenes no llaman la atención. Lucen como cualquier otro centro de distribución. Muchos ocupan cientos de miles de pies cuadrados, y docenas de camiones entran y salen a diario. Pero cuando se cargan, descargan y trasladan los productos médicos desde estas instalaciones, se libera óxido de etileno al aire. La mayoría de los residentes cercanos no tiene idea de que estos edificios sin señalamientos son una fuente de contaminantes tóxicos. Tampoco lo saben los conductores de los camiones, quienes a menudo trabajan por contrato, ni muchos de los empleados que trabajan en los almacenes.
Cuando Grist investigó sobre los almacenes de Cardinal Health en El Paso, nuestras periodistas distribuyeron folletos entre los residentes y trabajadores para que pudieran obtener más información y contactarnos. Estos están disponibles para ver y descargar aquí:
Cómo identificar estos almacenes
La primera lista, de unos 30 almacenes, incluye principalmente instalaciones que han reportado emisiones de óxido de etileno ya sea a la EPA o al Distrito de Gestión de la Calidad del Aire de la Costa Sur. Obtuvimos estas direcciones mediante solicitudes de registros públicos de las agencias. También identificamos algunos almacenes en esta lista tras hablar con conductores de camiones que transportan dispositivos médicos desde instalaciones de esterilización hacia almacenes.
La segunda lista consiste en almacenes propiedad o que son operados por algunos de los principales fabricantes de dispositivos médicos del país. Dado que teníamos una lista de 30 almacenes que sabemos que emiten óxido de etileno, identificamos a los fabricantes y distribuidores de dispositivos médicos que utilizan dichas bodegas para almacenarlos. Luego, ampliamos la búsqueda a todos los almacenes usados por esas empresas. Cabe aclarar que, no existe evidencia que sugiera que todos los almacenes de la segunda lista emitan óxido de etileno. En cambio, se presentan para mayor investigación por parte de periodistas locales y ciudadanos interesados.
.eto-national-map {
–color-primary: #3c3830;
–color-secondary: #dfdfdf;
–color-tertiary: #ccc;
–color-background: #F0F0F0;
–typography-primary: “PolySans”, sans-serif;
–typography-secondary: “Basis Grotesque”, sans-serif;
–color-confirmed: #638d09;
–color-potential: #1d2903;
–color-graticule: #ccc;
–color-country-stroke: #ffffff;
–color-country-fill: rgba(60, 56, 48, 0.8);
–color-user-location: #007bff;
font-family: var(–typography-secondary);
margin: 0;
padding: 0;
position: relative;
width: 100%;
margin-bottom: 2rem;
box-sizing: border-box;
}
.eto-national-map * {
box-sizing: border-box;
}
.eto-national-map__container {
position: relative;
width: 50vw;
left: 50%;
transform: translateX(-50%);
margin-top: 2rem;
min-width: 320px;
box-sizing: border-box;
}
.eto-national-map__title {
margin: 0;
padding: 20px 0 5px;
font-size: 1.5rem;
text-align: left;
font-family: var(–typography-primary);
font-weight: normal;
}
.eto-national-map__subhed {
margin: 0 0 15px;
padding: 0;
font-size: 1rem;
text-align: left;
font-family: var(–typography-secondary);
font-weight: normal;
color: var(–color-primary);
line-height: 1.2;
}
.eto-national-map__search-container {
margin: 20px 0;
display: flex;
gap: 5px;
align-items: stretch;
flex-wrap: nowrap;
}
.eto-national-map__search-input {
flex-grow: 1;
padding: 8px 12px;
border: 1px solid var(–color-tertiary);
border-radius: 4px;
font-size: 14px;
font-family: var(–typography-secondary);
width: 100%;
}
.eto-national-map__search-button {
padding: 8px 15px;
background-color: var(–color-confirmed);
color: white;
border: none;
border-radius: 4px;
cursor: pointer;
font-size: 14px;
font-family: var(–typography-secondary);
transition: background-color 0.2s;
flex-shrink: 0;
width: auto;
line-height: normal;
}
.eto-national-map__search-button:hover {
background-color: #4a6a07;
}
.eto-national-map__search-results {
margin: 20px 0 40px;
font-size: 1rem;
font-style: normal;
color: var(–color-primary);
line-height: 1.2;
}
.eto-national-map__graticule {
fill: none;
stroke: var(–color-graticule);
stroke-width: 0.5px;
}
.eto-national-map__state {
fill: var(–color-country-fill);
}
.eto-national-map__state-borders {
fill: none;
stroke: var(–color-country-stroke);
stroke-width: 1.5px;
}
.eto-national-map__country-outline {
fill: none;
stroke: var(–color-primary);
stroke-width: 1px;
}
.eto-national-map__location-dot {
cursor: pointer;
transition: opacity 0.3s, r 0.3s;
}
.eto-national-map__location-dot.confirmed {
fill: var(–color-confirmed);
stroke: white;
stroke-width: 1px;
}
.eto-national-map__location-dot.potential {
fill: var(–color-potential);
stroke: white;
stroke-width: 1px;
}
.eto-national-map__tooltip {
position: absolute;
pointer-events: none;
background-color: rgba(255, 255, 255, 0.95);
color: var(–color-primary);
padding: 12px;
border-radius: 4px;
font-size: 12px;
z-index: 999;
opacity: 0;
transition: opacity 0.3s;
box-shadow: 0 2px 10px rgba(0, 0, 0, 0.15);
max-width: 300px;
border: 1px solid var(–color-tertiary);
}
.eto-national-map__tooltip.visible {
opacity: 1;
transform: translateY(0);
}
.eto-national-map__tooltip h3 {
margin: 0 0 8px 0;
padding-bottom: 6px;
border-bottom: 1px solid var(–color-tertiary);
font-size: 14px;
}
.eto-national-map__tooltip p {
margin: 3px 0;
font-size: 12px;
}
.eto-national-map__loading {
position: absolute;
top: 50%;
left: 50%;
transform: translate(-50%, -50%);
font-size: 18px;
color: var(–color-primary);
}
.eto-national-map__legend {
margin-top: 10px;
display: flex;
justify-content: center;
gap: 20px;
font-size: 1rem;
font-family: var(–typography-secondary);
margin-bottom: 10px;
}
.eto-national-map__legend-item {
display: flex;
align-items: center;
gap: 5px;
}
.eto-national-map__legend-dot {
width: 12px;
height: 12px;
border-radius: 50%;
stroke: white;
stroke-width: 1px;
}
.eto-national-map__legend-dot.confirmed {
background-color: var(–color-confirmed);
}
.eto-national-map__legend-dot.potential {
background-color: var(–color-potential);
}
.eto-national-map__puerto-rico-container {
position: absolute;
bottom: 5px;
right: 20px;
width: 150px;
height: 100px;
border: 1px solid var(–color-tertiary);
background-color: #f0f0f0;
border-radius: 4px;
overflow: hidden;
box-shadow: 0 2px 5px rgba(0, 0, 0, 0.1);
}
.eto-national-map__zoom-controls {
position: absolute;
bottom: 115px;
right: 20px;
display: flex;
flex-direction: column;
gap: 5px;
z-index: 10;
}
.eto-national-map__zoom-button {
width: 30px;
height: 30px;
background-color: #f0f0f0;
border: 1px solid var(–color-tertiary);
border-radius: 4px;
font-size: 18px;
font-weight: bold;
color: #3c3830;
cursor: pointer;
display: flex;
align-items: center;
justify-content: center;
box-shadow: 0 1px 3px rgba(0, 0, 0, 0.1);
transition: background-color 0.2s;
}
.eto-national-map__zoom-button:hover {
background-color: rgba(255, 255, 255, 1);
}
.eto-national-map__reset-button {
width: 30px;
height: 30px;
background-color: #f0f0f0;
border: 1px solid var(–color-tertiary);
border-radius: 4px;
font-size: 14px;
font-weight: normal;
color: #3c3830;
cursor: pointer;
display: flex;
align-items: center;
justify-content: center;
box-shadow: 0 1px 3px rgba(0, 0, 0, 0.1);
transition: background-color 0.2s;
padding: 0;
}
.eto-national-map__reset-button:hover {
background-color: rgba(255, 255, 255, 1);
}
.eto-national-map__pr-label {
font-size: 10px;
font-family: var(–typography-secondary);
fill: #f0f0f0;
text-anchor: middle;
text-transform: uppercase;
}
.eto-national-map__source {
color: #3c3830;
font-size: 12px;
text-align: left;
font-style: italic;
font-weight: bold;
margin-top: 5px;
padding-right: 0;
max-width: 60%;
}
.eto-national-map__source a {
text-decoration: underline;
}
@media (max-width: 768px) {
.eto-national-map {
width: 100%;
margin: 0;
}
.eto-national-map__container {
position: relative;
width: 100%;
max-width: none;
left: 0;
transform: none;
margin: 0;
padding: 0 1rem;
min-width: 0;
}
.eto-national-map__tooltip {
max-width: 260px;
padding: 14px;
font-size: 14px;
box-shadow: 0 4px 15px rgba(0, 0, 0, 0.2);
border: 1px solid var(–color-graticule);
background-color: rgba(255, 255, 255, 0.98);
}
.eto-national-map__tooltip p {
font-size: 14px !important;
margin: 5px 0 !important;
}
.eto-national-map__tooltip h3 {
font-size: 16px !important;
}
.eto-national-map__puerto-rico-container {
width: 120px;
height: 80px;
bottom: 2px;
right: 10px;
}
.eto-national-map__zoom-controls {
bottom: 95px;
right: 10px;
}
.eto-national-map__source {
font-size: 10px;
text-align: left;
padding-right: 10px;
max-width: 60%;
}
.eto-national-map__pr-label {
font-size: 8px;
}
.eto-national-map__search-container {
flex-direction: column;
align-items: stretch;
max-width: none;
}
.eto-national-map__search-input {
font-size: 16px;
}
.eto-national-map__search-button {
font-size: 16px;
padding: 10px 15px;
}
.eto-national-map__search-results {
font-size: 1rem;
}
}
.eto-national-map__suggestions-container {
position: relative;
flex-grow: 1;
}
.eto-national-map__suggestions-list {
position: absolute;
background-color: white;
border: 1px solid var(–color-tertiary);
border-top: none;
border-radius: 0 0 4px 4px;
list-style: none;
margin: 0;
padding: 0;
width: 100%;
max-height: 200px;
overflow-y: auto;
z-index: 1000;
box-shadow: 0 4px 6px rgba(0, 0, 0, 0.1);
display: none;
}
.eto-national-map__suggestions-list.visible {
display: block;
}
.eto-national-map__suggestions-item {
padding: 8px 12px;
cursor: pointer;
font-size: 13px;
border-bottom: 1px solid var(–color-secondary);
}
.eto-national-map__suggestions-item:last-child {
border-bottom: none;
}
.eto-national-map__suggestions-item:hover {
background-color: var(–color-background);
}
Almacenes que albergan productos esterilizados con óxido de etileno
Grist recopiló una lista de bodegas en Estados Unidos que informaron que almacenan productos esterilizados con óxido de etileno y otros utilizados por los principales fabricantes y distribuidores de dispositivos médicos.
Confirmados
Potenciales
let mapInitialized = false; // Flag to prevent multiple initializations
function initMap() {
if (mapInitialized) return; // Exit if already initialized
if (typeof d3 === ‘undefined’ || typeof topojson === ‘undefined’) {
setTimeout(initMap, 100);
return;
}
mapInitialized = true; // Set flag after dependency check
document.addEventListener(‘touchstart’, function(event) {
const tooltip = document.getElementById(‘tooltip’);
const target = event.target;
if (!target.classList.contains(‘eto-national-map__location-dot’) && tooltip) {
hideTooltip();
}
}, { passive: false });
document.addEventListener(‘click’, function(event) {
const tooltip = document.getElementById(‘tooltip’);
const target = event.target;
if (!target.classList.contains(‘eto-national-map__location-dot’) && tooltip) {
hideTooltip();
}
});
const width = 1000;
const height = 600;
const margin = { top: 10, right: 20, bottom: 40, left: 20 };
const svg = d3.select(“#map”).append(“svg”)
.attr(“width”, “100%”)
.attr(“height”, “100%”)
.attr(“viewBox”, `0 0 ${width} ${height}`)
.attr(“preserveAspectRatio”, “xMidYMid meet”)
.style(“max-width”, “100%”)
.style(“height”, “auto”);
const defs = svg.append(“defs”);
const filter = defs.append(“filter”)
.attr(“id”, “drop-shadow”)
.attr(“height”, “130%”);
filter.append(“feGaussianBlur”)
.attr(“in”, “SourceAlpha”)
.attr(“stdDeviation”, 3)
.attr(“result”, “blur”);
filter.append(“feOffset”)
.attr(“in”, “blur”)
.attr(“dx”, 2)
.attr(“dy”, 2)
.attr(“result”, “offsetBlur”);
filter.append(“feFlood”)
.attr(“flood-color”, “#3c3830”)
.attr(“flood-opacity”, 0.3)
.attr(“result”, “offsetColor”);
filter.append(“feComposite”)
.attr(“in”, “offsetColor”)
.attr(“in2”, “offsetBlur”)
.attr(“operator”, “in”)
.attr(“result”, “offsetBlur”);
const feMerge = filter.append(“feMerge”);
feMerge.append(“feMergeNode”)
.attr(“in”, “offsetBlur”)
feMerge.append(“feMergeNode”)
.attr(“in”, “SourceGraphic”);
const prContainer = d3.select(“#map”).append(“div”)
.attr(“class”, “eto-national-map__puerto-rico-container”);
const prSvg = prContainer.append(“svg”)
.attr(“width”, “100%”)
.attr(“height”, “100%”)
.attr(“viewBox”, “0 0 150 100”)
.attr(“preserveAspectRatio”, “xMidYMid meet”);
const tooltip = d3.select(“#tooltip”);
const projection = d3.geoAlbersUsa()
.scale(1200)
.translate([width / 2, height / 2]);
const prProjection = d3.geoMercator()
.center([-66.5, 18.2])
.scale(4000)
.translate([75, 50]);
const path = d3.geoPath().projection(projection);
const prPath = d3.geoPath().projection(prProjection);
const g = svg.append(“g”);
const baseDotRadius = 9;
const baseStrokeWidth = 1;
const prBaseDotRadius = 6;
async function loadData() {
try {
const csvData = await d3.csv(“https://raw.githubusercontent.com/Grist-Data-Desk/eto-warehouses/refs/heads/main/eto-warehouses.csv”);
return csvData.map(d => ({
company: d.Company,
address: d[“Warehouse Address”],
state: d.State,
source: d.Source,
type: d.Type,
latitude: +d.Latitude,
longitude: +d.Longitude
}));
} catch (error) {
console.error(“Error loading CSV data:”, error);
return [];
}
}
async function drawMap() {
try {
const us = await d3.json(“https://cdn.jsdelivr.net/npm/us-atlas@3/states-10m.json”);
const warehouseData = await loadData();
d3.select(“.eto-national-map__loading”).remove();
const states = topojson.feature(us, us.objects.states);
const statesMesh = topojson.mesh(us, us.objects.states);
g.append(“g”)
.attr(“filter”, “url(#drop-shadow)”)
.selectAll(“path”)
.data(states.features)
.enter().append(“path”)
.attr(“class”, “eto-national-map__state”)
.attr(“d”, path);
g.append(“path”)
.datum(statesMesh)
.attr(“class”, “eto-national-map__state-borders”)
.attr(“d”, path);
g.append(“path”)
.datum(topojson.mesh(us, us.objects.states, (a, b) => a === b))
.attr(“class”, “eto-national-map__country-outline”)
.attr(“d”, path);
const puertoRico = us.objects.states.geometries.find(d => d.id === “72”);
if (puertoRico) {
const prFeature = topojson.feature(us, {
type: “GeometryCollection”,
geometries: [puertoRico]
});
prSvg.append(“g”)
.selectAll(“path”)
.data(prFeature.features)
.enter().append(“path”)
.attr(“class”, “eto-national-map__state”)
.attr(“d”, prPath);
prSvg.append(“path”)
.datum(prFeature)
.attr(“class”, “eto-national-map__country-outline”)
.attr(“d”, prPath);
prSvg.append(“text”)
.attr(“class”, “eto-national-map__pr-label”)
.attr(“x”, 75)
.attr(“y”, 51)
.text(“Puerto Rico”);
}
const mainlandPoints = warehouseData.filter(d =>
!isNaN(d.latitude) && !isNaN(d.longitude) &&
!(d.state === “PR” || d.state === “Puerto Rico”));
const puertoRicoPoints = warehouseData.filter(d =>
!isNaN(d.latitude) && !isNaN(d.longitude) &&
(d.state === “PR” || d.state === “Puerto Rico”));
g.selectAll(“.eto-national-map__location-dot.mainland”)
.data(mainlandPoints)
.enter()
.append(“circle”)
.attr(“class”, d => `eto-national-map__location-dot mainland ${d.type.toLowerCase() === “confirmed” ? “confirmed” : “potential”}`)
.attr(“cx”, d => {
const coords = projection([d.longitude, d.latitude]);
return coords ? coords[0] : null;
})
.attr(“cy”, d => {
const coords = projection([d.longitude, d.latitude]);
return coords ? coords[1] : null;
})
.attr(“r”, baseDotRadius)
.style(“stroke-width”, baseStrokeWidth)
.style(“opacity”, 0.8)
.on(“mouseover”, function(event, d) {
const currentScale = d3.zoomTransform(svg.node()).k || 1;
d3.select(this)
.transition()
.duration(200)
.attr(“r”, baseDotRadius * 1.3 / currentScale)
.style(“opacity”, 1);
showTooltip(event, d);
})
.on(“mouseout”, function() {
const currentScale = d3.zoomTransform(svg.node()).k || 1;
d3.select(this)
.transition()
.duration(200)
.attr(“r”, baseDotRadius / currentScale)
.style(“opacity”, 0.8);
hideTooltip();
})
.on(“touchstart”, function(event, d) {
event.preventDefault();
const wasVisible = tooltip.classed(“visible”);
hideTooltip();
const currentScale = d3.zoomTransform(svg.node()).k || 1;
d3.select(this)
.attr(“r”, wasVisible ? baseDotRadius / currentScale : baseDotRadius * 1.3 / currentScale)
.style(“opacity”, wasVisible ? 0.8 : 1);
if (!wasVisible) {
showTooltip(event.touches[0], d);
} else {
d3.select(this)
.transition()
.duration(200)
.attr(“r”, baseDotRadius / currentScale)
.style(“opacity”, 0.8);
}
});
prSvg.selectAll(“.eto-national-map__location-dot.puerto-rico”)
.data(puertoRicoPoints)
.enter()
.append(“circle”)
.attr(“class”, d => `eto-national-map__location-dot puerto-rico ${d.type.toLowerCase() === “confirmed” ? “confirmed” : “potential”}`)
.attr(“cx”, d => {
const coords = prProjection([d.longitude, d.latitude]);
return coords ? coords[0] : null;
})
.attr(“cy”, d => {
const coords = prProjection([d.longitude, d.latitude]);
return coords ? coords[1] : null;
})
.attr(“r”, prBaseDotRadius)
.style(“opacity”, 0.8)
.on(“mouseover”, function(event, d) {
d3.select(this)
.transition()
.duration(200)
.attr(“r”, prBaseDotRadius * 1.3)
.style(“opacity”, 1);
const rect = prSvg.node().getBoundingClientRect();
const evt = {
clientX: rect.left + parseFloat(d3.select(this).attr(“cx”)),
clientY: rect.top + parseFloat(d3.select(this).attr(“cy”))
};
showTooltip(evt, d);
})
.on(“mouseout”, function() {
d3.select(this)
.transition()
.duration(200)
.attr(“r”, prBaseDotRadius)
.style(“opacity”, 0.8);
hideTooltip();
})
.on(“touchstart”, function(event, d) {
event.preventDefault();
const wasVisible = tooltip.classed(“visible”);
hideTooltip();
if (!wasVisible) {
d3.select(this)
.transition()
.duration(200)
.attr(“r”, prBaseDotRadius * 1.3)
.style(“opacity”, 1);
const rect = prSvg.node().getBoundingClientRect();
const evt = {
clientX: rect.left + parseFloat(d3.select(this).attr(“cx”)),
clientY: rect.top + parseFloat(d3.select(this).attr(“cy”))
};
showTooltip(evt, d);
}
});
const zoom = d3.zoom()
.scaleExtent([1, 8])
.on(“zoom”, zoomed);
svg.call(zoom);
d3.select(“#zoom-in”).on(“click”, function() {
svg.transition().duration(300).call(zoom.scaleBy, 1.3);
});
d3.select(“#zoom-out”).on(“click”, function() {
svg.transition().duration(300).call(zoom.scaleBy, 1 / 1.3);
});
zoomed({ transform: d3.zoomIdentity });
const searchInput = d3.select(“#address-input”);
const searchButton = d3.select(“#search-button”);
const searchResults = d3.select(“#search-results”);
const suggestionsList = d3.select(“#search-suggestions”);
let currentSuggestions = [];
async function fetchSuggestions(query) {
if (!query || query.length 0) {
suggestions.forEach((item, index) => {
suggestionsList.append(“li”)
.attr(“class”, “eto-national-map__suggestions-item”)
.text(item.display_name)
.on(“click”, () => {
selectSuggestion(index);
});
});
suggestionsList.classed(“visible”, true);
} else {
hideSuggestions();
}
} else {
hideSuggestions();
}
}
function hideSuggestions() {
suggestionsList.classed(“visible”, false);
currentSuggestions = [];
}
function selectSuggestion(index) {
if (index = currentSuggestions.length) return;
const selected = currentSuggestions[index];
searchInput.property(“value”, selected.display_name);
hideSuggestions();
searchResults.text(“Processing selected location…”);
processSelectedLocation(selected);
}
async function handleSearch() {
const query = searchInput.property(“value”).trim();
hideSuggestions();
if (!query) {
searchResults.text(“Please enter an address or zip code.”);
return;
}
searchResults.text(“Buscando…”);
removeUserMarker();
try {
const response = await fetch(`https://nominatim.openstreetmap.org/search?format=json&q=${encodeURIComponent(query)}&countrycodes=us,pr&limit=1`, {
headers: {
‘User-Agent’: ‘Grist EtO Warehouse Map/1.0 (contact: caldern@grist.org)’
}
});
if (!response.ok) throw new Error(`HTTP error! status: ${response.status}`);
const data = await response.json();
if (data && data.length > 0) {
processSelectedLocation(data[0]);
} else {
searchResults.text(“Address not found. Please try a different search.”);
}
} catch (error) {
console.error(“Error during geocoding search:”, error);
searchResults.text(“Error searching for address. Please try again later.”);
}
}
function processSelectedLocation(locationData) {
const userLat = parseFloat(locationData.lat);
const userLon = parseFloat(locationData.lon);
const displayName = locationData.display_name;
const userLocation = { longitude: userLon, latitude: userLat };
searchInput.property(“value”, displayName);
removeUserMarker();
addUserMarker(userLocation);
const coords = projection([userLon, userLat]);
let mapPanningMessage = “”;
if (coords) {
svg.transition().duration(750).call(
zoom.transform,
d3.zoomIdentity.translate(width / 2, height / 2).scale(4).translate(-coords[0], -coords[1])
);
} else {
mapPanningMessage = ” (Map panning only available for mainland US)”;
}
const nearest = findNearestWarehouse(userLocation, mainlandPoints.concat(puertoRicoPoints));
const locationSpan = `📍 `;
const warehouseSpan = `🚚 `;
let warehouseText = “No nearby warehouses found.”;
if (nearest) {
const distance = calculateDistance(userLat, userLon, nearest.warehouse.latitude, nearest.warehouse.longitude);
const warehouseTypeRaw = nearest.warehouse.type.toLowerCase();
const warehouseTypeSpanish = warehouseTypeRaw === ‘confirmed’ ? ‘confirmado’ : (warehouseTypeRaw === ‘potential’ ? ‘potencial’ : warehouseTypeRaw);
const warehouseName = nearest.warehouse.company;
warehouseText = `Almacén ${warehouseTypeSpanish} más cercano: ${warehouseName} (${distance.toFixed(1)} millas de distancia)`;
highlightWarehouse(nearest.warehouse);
}
const locationString = `${locationSpan}Ubicación buscada: ${displayName}${mapPanningMessage}`;
const finalHtml = `${locationString}
${warehouseSpan}${warehouseText}`;
searchResults.html(finalHtml);
}
searchInput.on(“input”, function() {
const query = searchInput.property(“value”).trim();
fetchSuggestions(query).catch(error => console.error(“Error in fetchSuggestions call:”, error));
});
d3.select(document).on(“click”, function(event) {
const target = event.target;
const isInput = target === searchInput.node();
const isSuggestion = suggestionsList.node().contains(target);
if (!isInput && !isSuggestion) {
hideSuggestions();
}
});
searchButton.on(“click”, handleSearch);
searchInput.on(“keypress”, function(event) {
if (event.key === “Enter”) {
event.preventDefault();
handleSearch();
}
});
function calculateDistance(lat1, lon1, lat2, lon2) {
const R = 3958.8; // Radius of the Earth in miles
const dLat = (lat2 – lat1) * Math.PI / 180;
const dLon = (lon2 – lon1) * Math.PI / 180;
const a =
Math.sin(dLat / 2) * Math.sin(dLat / 2) +
Math.cos(lat1 * Math.PI / 180) * Math.cos(lat2 * Math.PI / 180) *
Math.sin(dLon / 2) * Math.sin(dLon / 2);
const c = 2 * Math.atan2(Math.sqrt(a), Math.sqrt(1 – a));
return R * c; // Distance in miles
}
function findNearestWarehouse(userLocation, warehouses) {
let minDistance = Infinity;
let nearestWarehouse = null;
warehouses.forEach(warehouse => {
if (!isNaN(warehouse.latitude) && !isNaN(warehouse.longitude)) {
const distance = calculateDistance(userLocation.latitude, userLocation.longitude, warehouse.latitude, warehouse.longitude);
if (distance d.company === warehouse.company && d.address === warehouse.address);
if (!dot.empty()) {
const currentScale = d3.zoomTransform(svg.node()).k || 1;
dot.raise()
.classed(“highlighted”, true)
.transition()
.duration(300)
.attr(“r”, baseDotRadius * 1.5 / currentScale)
.style(“stroke”, “var(–color-user-location)”)
.style(“stroke-width”, 2 / currentScale);
}
}
function resetMap() {
svg.transition().duration(750).call(zoom.transform, d3.zoomIdentity);
searchInput.property(“value”, “”);
searchResults.text(“”);
hideSuggestions();
removeUserMarker();
g.selectAll(“.eto-national-map__location-dot.highlighted”)
.classed(“highlighted”, false)
.transition()
.duration(200)
.style(“stroke”, “white”)
.attr(“r”, baseDotRadius / (d3.zoomTransform(svg.node()).k || 1))
.style(“stroke-width”, baseStrokeWidth / (d3.zoomTransform(svg.node()).k || 1));
}
d3.select(“#reset-view”).on(“click”, resetMap);
} catch (error) {
console.error(“Error drawing map:”, error);
d3.select(“.eto-national-map__loading”).text(“Error loading map data. Please try again later.”);
}
}
function zoomed(event) {
const { transform } = event;
g.attr(“transform”, transform);
g.selectAll(“.eto-national-map__location-dot.mainland”)
.attr(“r”, baseDotRadius / transform.k)
.style(“stroke-width”, baseStrokeWidth / transform.k);
g.selectAll(“.eto-national-map__state-borders”)
.style(“stroke-width”, baseStrokeWidth / transform.k);
g.selectAll(“.eto-national-map__country-outline”)
.style(“stroke-width”, baseStrokeWidth / transform.k);
g.select(“#user-location-marker”)
.attr(“r”, 8 / transform.k)
.attr(“stroke-width”, 1.5 / transform.k);
g.selectAll(“.eto-national-map__location-dot.highlighted”)
.attr(“r”, baseDotRadius * 1.5 / transform.k)
.style(“stroke-width”, 2 / transform.k);
}
function showTooltip(event, d) {
const mapContainer = document.querySelector(‘.eto-national-map__container’).getBoundingClientRect();
const tooltipWidth = window.innerWidth <= 768 ? 260 : 250;
const tooltipHeight = window.innerWidth mapContainer.width) {
tooltipX = mouseX – tooltipWidth – tooltipOffset;
}
if (tooltipY + tooltipHeight > mapContainer.height) {
tooltipY = mouseY – tooltipHeight – tooltipOffset;
}
tooltipX = Math.max(10, Math.min(mapContainer.width – tooltipWidth – 10, tooltipX));
tooltipY = Math.max(10, Math.min(mapContainer.height – tooltipHeight – 10, tooltipY));
const statusRaw = d.type || ”;
const statusSpanish = statusRaw.toLowerCase() === ‘confirmed’ ? ‘Confirmado’ : (statusRaw.toLowerCase() === ‘potential’ ? ‘Potencial’ : statusRaw);
const tooltipContent = `
${d.company}
Dirección: ${d.address}
Estado: ${d.state}
Estatus: ${statusSpanish}
`;
tooltip
.style(“left”, `${tooltipX}px`)
.style(“top”, `${tooltipY}px`)
.html(tooltipContent)
.classed(“visible”, true)
.style(“opacity”, 1);
}
function hideTooltip() {
tooltip.classed(“visible”, false).style(“opacity”, 0);
}
drawMap();
}
if (document.readyState === ‘loading’) {
document.addEventListener(‘DOMContentLoaded’, initMap);
} else {
initMap();
}
Cómo localizar almacenes en su zona
Revise las dos listas que hemos recopilado. ¿Hay alguno en su zona ¿Existe alguna compañía que opere en su región o en su estado?
Si no encuentra ningún almacén en su región en nuestras listas, haga usted una lista de las empresas y distribuidores de dispositivos médicos en su estado. Las compañías principales que hemos hallado en nuestra investigación son Cardinal Health, Medline y Owens & Minor. Luego, intente identificar dónde almacenan productos. Puede hallar esta información consultando:
El sitio web de la empresa
Algunas compañías enlistan sus instalaciones — incluyendo almacenes — en las secciones “About Us” (“Acerca de nosotros”) o “Locations” (“Ubicaciones”) en su sitio web. Si la empresa tiene un portal de empleos, busque puestos relacionados con los almacenes y revise si se menciona la ubicación del empleo.
Archivos de la Comisión de Bolsa y Valores de los Estados Unidos (SEC, por sus siglas en inglés)
Si la compañía cotiza en la bolsa, deberá presentar información financiera ante la Securities and Exchange Commission. Busque los archivos de la empresa en la base de datos EDGAR de la SEC. Algunas veces, las compañías divulgan su riesgo ante litigios o regulaciones relacionadas con el óxido de etileno. Algunas compañías también enlistan sus activos en estos archivos, incluyendo la ubicación de sus instalaciones.
Google Maps
Busque una empresa de dispositivos médicos en su zona. Por ejemplo, si está interesado en Medline, puede intentar con “Almacén de Medline” o “Centro de distribución de Medline” y ver si aparece alguno cerca de usted.
Si soy un reportero local o un residente interesado, ¿qué puedo hacer con esta información ahora que sé en dónde se ubica un almacén?
Una vez que haya identificado una bodega en la que sospeche se almacenen productos esterilizados con óxido de etileno, puede intentar confirmar si emite este químico a través de alguno de estos métodos:
Pida las solicitudes de registros a las agencias ambientales locales y estatales
Contacte a la agencia municipal o estatal que regula la calidad del aire en su región. Suele ser el departamento estatal de calidad ambiental, pero en ocasiones puede tratarse de distritos regionales de la calidad del aire (como en California) o de oficinas municipales ambientales. Pregunte por todas las solicitudes de permisos de calidad del aire presentadas por el operador del almacén en cuestión o por toda la correspondencia del operador del almacén en donde se mencione el óxido de etileno.
Intente conectar el almacén con una instalación de esterilización
Los productos son, primero, fumigados con óxido de etileno en las instalaciones de esterilización, antes de ser enviados a bodegas para su almacenamiento. Si los productos están siendo entregados desde un esterilizador al almacén que usted está investigando, ese es un fuerte indicador de que dicho almacén emite alguna cantidad de óxido de etileno. Existen dos enfoques principales que se pueden adoptar cuando se intenta establecer la cadena de suministro hacia los almacenes.
- Hablar con los conductores que hacen entregas en los almacenes: Puede intentar determinar de dónde provienen los productos hablando con los conductores de los camiones que entregan cargamentos al almacén.
- Hablar con los conductores que salen de las instalaciones de esterilización: Hay menos de 100 instalaciones de esterilización en el país, y la EPA tiene una lista de ellos aquí. Si alguna está cerca de usted, puede pedir a los camioneros información sobre a dónde llevan los productos.
- Contactar a la compañía: Algunas compañías cuentan con personal de relaciones públicas o de enlace comunitario que responden a las preguntas de los residentes. Intente contactarlos para ver si están dispuestos a hablar con usted.
Hable con los trabajadores
Intente hablar con los empleados de los almacenes cuando estén en su descanso o al final de su turno. Las empresas tienen la obligación de informar a sus trabajadores sobre la exposición al óxido de etileno, así que puede preguntarles si han estado presentes en alguna reunión en donde los gerentes les hayan hablado de la exposición a un químico. Incluso así, muchos trabajadores desconocen si están expuestos al óxido de etileno. Pero pregúnteles si la instalación cuenta con monitores de la calidad del aire, y si es así, si saben qué es lo que monitorean.
Si soy un residente que quiere involucrarse pero no tengo experiencia periodística, ¿qué puedo hacer para obtener más información?
- Revise este mapa e informe de 2023 que evalúa 104 instalaciones que emiten óxido de etileno, elaborado por la Union of Concerned Scientists
- Cualquier persona puede presentar una solicitud bajo la Ley de Libertad de Información, o FOIA (por sus siglas en inglés), para obtener información pública del gobierno federal. También puede presentar una solicitud de registros públicos para obtener información de las agencias locales y estatales. Existen muchos recursos para ayudarle a elaborarlas:
– FOIA Wiki, creado por Comité de Reporteros por la Libertad de Prensa
– El sitio web federal de FOIA
- Lea nuestras otras historias para conocer más detalles sobre el óxido de etileno:
– ‘Dulce’: Una sustancia química de olor dulzón trastoca la vida de los salinenses
– Un químico invisible está envenenado a miles de desprevenidos trabajadores de almacenes
Esta historia fue traducida por Sonia Ramírez.
This story was originally published by Grist with the headline ¿Su comunidad está en riesgo? Cómo acceder a la información y contar historias sobre el EtO on Apr 16, 2025.
]]>
6625229
https://grist.org/health/ethylene-oxide-el-paso-texas-unregulated-toxic-warehouse/
Wed, 16 Apr 2025 08:45:00 +0000
https://grist.org/?p=662538
<
Ivan Pierre Aguirre / Grist
After they moved in, Dominguez’s daughter quickly took to running around in the backyard, which featured a cherry blossom tree, and the family often grilled outside. Dominguez barely noticed the warehouse just beyond the cobblestone wall at the back. It really wasn’t until the COVID-19 stay-at-home mandate in 2020 that she noticed the stream of trucks pulling in and out of the facility. Sometimes, she would hear the rumble of 18-wheelers as early as 6:30 a.m.
Still, she made little of it. She didn’t realize that the warehouse was owned by Cardinal Health, one of the largest medical device distributors in the country, or that it is part of a vast supply chain that the American public relies on to receive proper medical care.
But for Dominguez and her family, what seemed little more than a minor nuisance was actually a sprawling menace — one that a Grist data analysis found was exposing them to exceedingly high levels of a dangerous chemical.
Cardinal Health uses that warehouse, and another one across town, to store medical devices that have been sterilized with ethylene oxide. Among the thousands of compounds released every day from polluting facilities, it’s among the most toxic, responsible for more than half of all excess cancer risk from industrial operations nationwide. Long-term exposure to the chemical has been linked to cancers of the breast and lymph nodes, and short-term exposure can cause irritation of the nasal cavity, shortness of breath, wheezing, and bronchial constriction. Dominguez’s family would go on to experience some of these symptoms, but only years later would they tie it to ethylene oxide exposure.
Warehouses like the ones in El Paso are ubiquitous throughout the country. Through records requests and on-the-ground reporting, Grist has identified at least 30 warehouses across the country that definitely emit some amount of ethylene oxide. They are used by companies such as Boston Scientific, ConMed, and Becton Dickinson, as well as Cardinal Health. And they are not restricted to industrial parts of towns — they are near schools and playgrounds, gyms and apartment complexes. From the outside, the warehouses do not attract attention. They look like any other distribution center. Many occupy hundreds of thousands of square feet, and dozens of trucks pull in and out every day. But when these facilities load, unload, and move medical products, they belch ethylene oxide into the air. Most residents nearby have no idea that the nondescript buildings are a source of toxic pollution. Neither do most truck drivers, who are often hired on a contract basis, or many of the workers employed at the warehouses.
.eto-national-map {
–color-primary: #3c3830;
–color-secondary: #dfdfdf;
–color-tertiary: #ccc;
–color-background: #F0F0F0;
–typography-primary: “PolySans”, sans-serif;
–typography-secondary: “Basis Grotesque”, sans-serif;
–color-confirmed: #638d09;
–color-potential: #1d2903;
–color-graticule: #ccc;
–color-country-stroke: #ffffff;
–color-country-fill: rgba(60, 56, 48, 0.8);
–color-user-location: #007bff;
font-family: var(–typography-secondary);
margin: 0;
padding: 0;
position: relative;
width: 100%;
margin-bottom: 2rem;
box-sizing: border-box;
}
.eto-national-map * {
box-sizing: border-box;
}
.eto-national-map__container {
position: relative;
width: 66.666vw;
left: 50%;
transform: translateX(-50%);
margin-top: 2rem;
min-width: 320px;
box-sizing: border-box;
}
.eto-national-map__title {
margin: 0;
padding: 20px 0 5px;
font-size: 1.5rem;
text-align: left;
font-family: var(–typography-primary);
font-weight: normal;
}
.eto-national-map__subhed {
margin: 0 0 15px;
padding: 0;
font-size: 1rem;
text-align: left;
font-family: var(–typography-secondary);
font-weight: normal;
color: var(–color-primary);
line-height: 1.2;
}
.eto-national-map__search-container {
margin: 20px 0;
display: flex;
gap: 5px;
align-items: stretch;
flex-wrap: nowrap;
}
.eto-national-map__search-input {
flex-grow: 1;
padding: 8px 12px;
border: 1px solid var(–color-tertiary);
border-radius: 4px;
font-size: 14px;
font-family: var(–typography-secondary);
width: 100%;
}
.eto-national-map__search-button {
padding: 8px 15px;
background-color: var(–color-confirmed);
color: white;
border: none;
border-radius: 4px;
cursor: pointer;
font-size: 14px;
font-family: var(–typography-secondary);
transition: background-color 0.2s;
flex-shrink: 0;
width: auto;
line-height: normal;
}
.eto-national-map__search-button:hover {
background-color: #4a6a07;
}
.eto-national-map__search-results {
margin: 20px 0 40px;
font-size: 1rem;
font-style: normal;
color: var(–color-primary);
line-height: 1.2;
}
.eto-national-map__graticule {
fill: none;
stroke: var(–color-graticule);
stroke-width: 0.5px;
}
.eto-national-map__state {
fill: var(–color-country-fill);
}
.eto-national-map__state-borders {
fill: none;
stroke: var(–color-country-stroke);
stroke-width: 1.5px;
}
.eto-national-map__country-outline {
fill: none;
stroke: var(–color-primary);
stroke-width: 1px;
}
.eto-national-map__location-dot {
cursor: pointer;
transition: opacity 0.3s, r 0.3s;
}
.eto-national-map__location-dot.confirmed {
fill: var(–color-confirmed);
stroke: white;
stroke-width: 1px;
}
.eto-national-map__location-dot.potential {
fill: var(–color-potential);
stroke: white;
stroke-width: 1px;
}
.eto-national-map__tooltip {
position: absolute;
pointer-events: none;
background-color: rgba(255, 255, 255, 0.95);
color: var(–color-primary);
padding: 12px;
border-radius: 4px;
font-size: 12px;
z-index: 999;
opacity: 0;
transition: opacity 0.3s;
box-shadow: 0 2px 10px rgba(0, 0, 0, 0.15);
max-width: 300px;
border: 1px solid var(–color-tertiary);
}
.eto-national-map__tooltip.visible {
opacity: 1;
transform: translateY(0);
}
.eto-national-map__tooltip h3 {
margin: 0 0 8px 0;
padding-bottom: 6px;
border-bottom: 1px solid var(–color-tertiary);
font-size: 14px;
}
.eto-national-map__tooltip p {
margin: 3px 0;
font-size: 12px;
}
.eto-national-map__loading {
position: absolute;
top: 50%;
left: 50%;
transform: translate(-50%, -50%);
font-size: 18px;
color: var(–color-primary);
}
.eto-national-map__legend {
margin-top: 10px;
display: flex;
justify-content: center;
gap: 20px;
font-size: 1rem;
font-family: var(–typography-secondary);
margin-bottom: 10px;
}
.eto-national-map__legend-item {
display: flex;
align-items: center;
gap: 5px;
}
.eto-national-map__legend-dot {
width: 12px;
height: 12px;
border-radius: 50%;
stroke: white;
stroke-width: 1px;
}
.eto-national-map__legend-dot.confirmed {
background-color: var(–color-confirmed);
}
.eto-national-map__legend-dot.potential {
background-color: var(–color-potential);
}
.eto-national-map__puerto-rico-container {
position: absolute;
bottom: 5px;
right: 20px;
width: 150px;
height: 100px;
border: 1px solid var(–color-tertiary);
background-color: #f0f0f0;
border-radius: 4px;
overflow: hidden;
box-shadow: 0 2px 5px rgba(0, 0, 0, 0.1);
}
.eto-national-map__zoom-controls {
position: absolute;
bottom: 115px;
right: 20px;
display: flex;
flex-direction: column;
gap: 5px;
z-index: 10;
}
.eto-national-map__zoom-button {
width: 30px;
height: 30px;
background-color: #f0f0f0;
border: 1px solid var(–color-tertiary);
border-radius: 4px;
font-size: 18px;
font-weight: bold;
color: #3c3830;
cursor: pointer;
display: flex;
align-items: center;
justify-content: center;
box-shadow: 0 1px 3px rgba(0, 0, 0, 0.1);
transition: background-color 0.2s;
}
.eto-national-map__zoom-button:hover {
background-color: rgba(255, 255, 255, 1);
}
.eto-national-map__reset-button {
width: 30px;
height: 30px;
background-color: #f0f0f0;
border: 1px solid var(–color-tertiary);
border-radius: 4px;
font-size: 14px;
font-weight: normal;
color: #3c3830;
cursor: pointer;
display: flex;
align-items: center;
justify-content: center;
box-shadow: 0 1px 3px rgba(0, 0, 0, 0.1);
transition: background-color 0.2s;
padding: 0;
}
.eto-national-map__reset-button:hover {
background-color: rgba(255, 255, 255, 1);
}
.eto-national-map__pr-label {
font-size: 10px;
font-family: var(–typography-secondary);
fill: #f0f0f0;
text-anchor: middle;
text-transform: uppercase;
}
.eto-national-map__source {
color: #3c3830;
font-size: 12px;
text-align: left;
font-style: italic;
font-weight: bold;
margin-top: 5px;
padding-right: 0;
max-width: 60%;
}
.eto-national-map__source a {
text-decoration: underline;
}
@media (max-width: 768px) {
.eto-national-map {
width: 100%;
margin: 0;
}
.eto-national-map__container {
position: relative;
width: 100%;
max-width: none;
left: 0;
transform: none;
margin: 0;
padding: 0 1rem;
min-width: 0;
}
.eto-national-map__tooltip {
max-width: 260px;
padding: 14px;
font-size: 14px;
box-shadow: 0 4px 15px rgba(0, 0, 0, 0.2);
border: 1px solid var(–color-graticule);
background-color: rgba(255, 255, 255, 0.98);
}
.eto-national-map__tooltip p {
font-size: 14px !important;
margin: 5px 0 !important;
}
.eto-national-map__tooltip h3 {
font-size: 16px !important;
}
.eto-national-map__puerto-rico-container {
width: 120px;
height: 80px;
bottom: 2px;
right: 10px;
}
.eto-national-map__zoom-controls {
bottom: 95px;
right: 10px;
}
.eto-national-map__source {
font-size: 10px;
text-align: left;
padding-right: 10px;
max-width: 60%;
}
.eto-national-map__pr-label {
font-size: 8px;
}
.eto-national-map__search-container {
flex-direction: column;
align-items: stretch;
max-width: none;
}
.eto-national-map__search-input {
font-size: 16px;
}
.eto-national-map__search-button {
font-size: 16px;
padding: 10px 15px;
}
.eto-national-map__search-results {
font-size: 1rem;
}
}
.eto-national-map__suggestions-container {
position: relative;
flex-grow: 1;
}
.eto-national-map__suggestions-list {
position: absolute;
background-color: white;
border: 1px solid var(–color-tertiary);
border-top: none;
border-radius: 0 0 4px 4px;
list-style: none;
margin: 0;
padding: 0;
width: 100%;
max-height: 200px;
overflow-y: auto;
z-index: 1000;
box-shadow: 0 4px 6px rgba(0, 0, 0, 0.1);
display: none;
}
.eto-national-map__suggestions-list.visible {
display: block;
}
.eto-national-map__suggestions-item {
padding: 8px 12px;
cursor: pointer;
font-size: 13px;
border-bottom: 1px solid var(–color-secondary);
}
.eto-national-map__suggestions-item:last-child {
border-bottom: none;
}
.eto-national-map__suggestions-item:hover {
background-color: var(–color-background);
}
Warehouses storing products sterilized with ethylene oxide
Grist assembled a list of U.S. warehouses that have reported storing products sterilized with ethylene oxide and others used by major medical device manufacturers and distributors.
Confirmed
Potential
let mapInitialized = false; // Flag to prevent multiple initializations
function initMap() {
if (mapInitialized) return; // Exit if already initialized
if (typeof d3 === ‘undefined’ || typeof topojson === ‘undefined’) {
setTimeout(initMap, 100);
return;
}
mapInitialized = true; // Set flag after dependency check
document.addEventListener(‘touchstart’, function(event) {
const tooltip = document.getElementById(‘tooltip’);
const target = event.target;
if (!target.classList.contains(‘eto-national-map__location-dot’) && tooltip) {
hideTooltip();
}
}, { passive: false });
document.addEventListener(‘click’, function(event) {
const tooltip = document.getElementById(‘tooltip’);
const target = event.target;
if (!target.classList.contains(‘eto-national-map__location-dot’) && tooltip) {
hideTooltip();
}
});
const width = 1000;
const height = 600;
const margin = { top: 10, right: 20, bottom: 40, left: 20 };
const svg = d3.select(“#map”).append(“svg”)
.attr(“width”, “100%”)
.attr(“height”, “100%”)
.attr(“viewBox”, `0 0 ${width} ${height}`)
.attr(“preserveAspectRatio”, “xMidYMid meet”)
.style(“max-width”, “100%”)
.style(“height”, “auto”);
const defs = svg.append(“defs”);
const filter = defs.append(“filter”)
.attr(“id”, “drop-shadow”)
.attr(“height”, “130%”);
filter.append(“feGaussianBlur”)
.attr(“in”, “SourceAlpha”)
.attr(“stdDeviation”, 3)
.attr(“result”, “blur”);
filter.append(“feOffset”)
.attr(“in”, “blur”)
.attr(“dx”, 2)
.attr(“dy”, 2)
.attr(“result”, “offsetBlur”);
filter.append(“feFlood”)
.attr(“flood-color”, “#3c3830”)
.attr(“flood-opacity”, 0.3)
.attr(“result”, “offsetColor”);
filter.append(“feComposite”)
.attr(“in”, “offsetColor”)
.attr(“in2”, “offsetBlur”)
.attr(“operator”, “in”)
.attr(“result”, “offsetBlur”);
const feMerge = filter.append(“feMerge”);
feMerge.append(“feMergeNode”)
.attr(“in”, “offsetBlur”)
feMerge.append(“feMergeNode”)
.attr(“in”, “SourceGraphic”);
const prContainer = d3.select(“#map”).append(“div”)
.attr(“class”, “eto-national-map__puerto-rico-container”);
const prSvg = prContainer.append(“svg”)
.attr(“width”, “100%”)
.attr(“height”, “100%”)
.attr(“viewBox”, “0 0 150 100”)
.attr(“preserveAspectRatio”, “xMidYMid meet”);
const tooltip = d3.select(“#tooltip”);
const projection = d3.geoAlbersUsa()
.scale(1200)
.translate([width / 2, height / 2]);
const prProjection = d3.geoMercator()
.center([-66.5, 18.2])
.scale(4000)
.translate([75, 50]);
const path = d3.geoPath().projection(projection);
const prPath = d3.geoPath().projection(prProjection);
const g = svg.append(“g”);
const baseDotRadius = 9;
const baseStrokeWidth = 1;
const prBaseDotRadius = 6;
async function loadData() {
try {
const csvData = await d3.csv(“https://raw.githubusercontent.com/Grist-Data-Desk/eto-warehouses/refs/heads/main/eto-warehouses.csv”);
return csvData.map(d => ({
company: d.Company,
address: d[“Warehouse Address”],
state: d.State,
source: d.Source,
type: d.Type,
latitude: +d.Latitude,
longitude: +d.Longitude
}));
} catch (error) {
console.error(“Error loading CSV data:”, error);
return [];
}
}
async function drawMap() {
try {
const us = await d3.json(“https://cdn.jsdelivr.net/npm/us-atlas@3/states-10m.json”);
const warehouseData = await loadData();
d3.select(“.eto-national-map__loading”).remove();
const states = topojson.feature(us, us.objects.states);
const statesMesh = topojson.mesh(us, us.objects.states);
g.append(“g”)
.attr(“filter”, “url(#drop-shadow)”)
.selectAll(“path”)
.data(states.features)
.enter().append(“path”)
.attr(“class”, “eto-national-map__state”)
.attr(“d”, path);
g.append(“path”)
.datum(statesMesh)
.attr(“class”, “eto-national-map__state-borders”)
.attr(“d”, path);
g.append(“path”)
.datum(topojson.mesh(us, us.objects.states, (a, b) => a === b))
.attr(“class”, “eto-national-map__country-outline”)
.attr(“d”, path);
const puertoRico = us.objects.states.geometries.find(d => d.id === “72”);
if (puertoRico) {
const prFeature = topojson.feature(us, {
type: “GeometryCollection”,
geometries: [puertoRico]
});
prSvg.append(“g”)
.selectAll(“path”)
.data(prFeature.features)
.enter().append(“path”)
.attr(“class”, “eto-national-map__state”)
.attr(“d”, prPath);
prSvg.append(“path”)
.datum(prFeature)
.attr(“class”, “eto-national-map__country-outline”)
.attr(“d”, prPath);
prSvg.append(“text”)
.attr(“class”, “eto-national-map__pr-label”)
.attr(“x”, 75)
.attr(“y”, 51)
.text(“Puerto Rico”);
}
const mainlandPoints = warehouseData.filter(d =>
!isNaN(d.latitude) && !isNaN(d.longitude) &&
!(d.state === “PR” || d.state === “Puerto Rico”));
const puertoRicoPoints = warehouseData.filter(d =>
!isNaN(d.latitude) && !isNaN(d.longitude) &&
(d.state === “PR” || d.state === “Puerto Rico”));
g.selectAll(“.eto-national-map__location-dot.mainland”)
.data(mainlandPoints)
.enter()
.append(“circle”)
.attr(“class”, d => `eto-national-map__location-dot mainland ${d.type.toLowerCase() === “confirmed” ? “confirmed” : “potential”}`)
.attr(“cx”, d => {
const coords = projection([d.longitude, d.latitude]);
return coords ? coords[0] : null;
})
.attr(“cy”, d => {
const coords = projection([d.longitude, d.latitude]);
return coords ? coords[1] : null;
})
.attr(“r”, baseDotRadius)
.style(“stroke-width”, baseStrokeWidth)
.style(“opacity”, 0.8)
.on(“mouseover”, function(event, d) {
const currentScale = d3.zoomTransform(svg.node()).k || 1;
d3.select(this)
.transition()
.duration(200)
.attr(“r”, baseDotRadius * 1.3 / currentScale)
.style(“opacity”, 1);
showTooltip(event, d);
})
.on(“mouseout”, function() {
const currentScale = d3.zoomTransform(svg.node()).k || 1;
d3.select(this)
.transition()
.duration(200)
.attr(“r”, baseDotRadius / currentScale)
.style(“opacity”, 0.8);
hideTooltip();
})
.on(“touchstart”, function(event, d) {
event.preventDefault();
const wasVisible = tooltip.classed(“visible”);
hideTooltip();
const currentScale = d3.zoomTransform(svg.node()).k || 1;
d3.select(this)
.attr(“r”, wasVisible ? baseDotRadius / currentScale : baseDotRadius * 1.3 / currentScale)
.style(“opacity”, wasVisible ? 0.8 : 1);
if (!wasVisible) {
showTooltip(event.touches[0], d);
} else {
d3.select(this)
.transition()
.duration(200)
.attr(“r”, baseDotRadius / currentScale)
.style(“opacity”, 0.8);
}
});
prSvg.selectAll(“.eto-national-map__location-dot.puerto-rico”)
.data(puertoRicoPoints)
.enter()
.append(“circle”)
.attr(“class”, d => `eto-national-map__location-dot puerto-rico ${d.type.toLowerCase() === “confirmed” ? “confirmed” : “potential”}`)
.attr(“cx”, d => {
const coords = prProjection([d.longitude, d.latitude]);
return coords ? coords[0] : null;
})
.attr(“cy”, d => {
const coords = prProjection([d.longitude, d.latitude]);
return coords ? coords[1] : null;
})
.attr(“r”, prBaseDotRadius)
.style(“opacity”, 0.8)
.on(“mouseover”, function(event, d) {
d3.select(this)
.transition()
.duration(200)
.attr(“r”, prBaseDotRadius * 1.3)
.style(“opacity”, 1);
const rect = prSvg.node().getBoundingClientRect();
const evt = {
clientX: rect.left + parseFloat(d3.select(this).attr(“cx”)),
clientY: rect.top + parseFloat(d3.select(this).attr(“cy”))
};
showTooltip(evt, d);
})
.on(“mouseout”, function() {
d3.select(this)
.transition()
.duration(200)
.attr(“r”, prBaseDotRadius)
.style(“opacity”, 0.8);
hideTooltip();
})
.on(“touchstart”, function(event, d) {
event.preventDefault();
const wasVisible = tooltip.classed(“visible”);
hideTooltip();
if (!wasVisible) {
d3.select(this)
.transition()
.duration(200)
.attr(“r”, prBaseDotRadius * 1.3)
.style(“opacity”, 1);
const rect = prSvg.node().getBoundingClientRect();
const evt = {
clientX: rect.left + parseFloat(d3.select(this).attr(“cx”)),
clientY: rect.top + parseFloat(d3.select(this).attr(“cy”))
};
showTooltip(evt, d);
}
});
const zoom = d3.zoom()
.scaleExtent([1, 8])
.on(“zoom”, zoomed);
svg.call(zoom);
d3.select(“#zoom-in”).on(“click”, function() {
svg.transition().duration(300).call(zoom.scaleBy, 1.3);
});
d3.select(“#zoom-out”).on(“click”, function() {
svg.transition().duration(300).call(zoom.scaleBy, 1 / 1.3);
});
zoomed({ transform: d3.zoomIdentity });
const searchInput = d3.select(“#address-input”);
const searchButton = d3.select(“#search-button”);
const searchResults = d3.select(“#search-results”);
const suggestionsList = d3.select(“#search-suggestions”);
let currentSuggestions = [];
async function fetchSuggestions(query) {
if (!query || query.length 0) {
suggestions.forEach((item, index) => {
suggestionsList.append(“li”)
.attr(“class”, “eto-national-map__suggestions-item”)
.text(item.display_name)
.on(“click”, () => {
selectSuggestion(index);
});
});
suggestionsList.classed(“visible”, true);
} else {
hideSuggestions();
}
} else {
hideSuggestions();
}
}
function hideSuggestions() {
suggestionsList.classed(“visible”, false);
currentSuggestions = [];
}
function selectSuggestion(index) {
if (index = currentSuggestions.length) return;
const selected = currentSuggestions[index];
searchInput.property(“value”, selected.display_name);
hideSuggestions();
searchResults.text(“Processing selected location…”);
processSelectedLocation(selected);
}
async function handleSearch() {
const query = searchInput.property(“value”).trim();
hideSuggestions();
if (!query) {
searchResults.text(“Please enter an address or zip code.”);
return;
}
searchResults.text(“Searching…”);
removeUserMarker();
try {
const response = await fetch(`https://nominatim.openstreetmap.org/search?format=json&q=${encodeURIComponent(query)}&countrycodes=us,pr&limit=1`, {
headers: {
‘User-Agent’: ‘Grist EtO Warehouse Map/1.0 (contact: caldern@grist.org)’
}
});
if (!response.ok) throw new Error(`HTTP error! status: ${response.status}`);
const data = await response.json();
if (data && data.length > 0) {
processSelectedLocation(data[0]);
} else {
searchResults.text(“Address not found. Please try a different search.”);
}
} catch (error) {
console.error(“Error during geocoding search:”, error);
searchResults.text(“Error searching for address. Please try again later.”);
}
}
function processSelectedLocation(locationData) {
const userLat = parseFloat(locationData.lat);
const userLon = parseFloat(locationData.lon);
const displayName = locationData.display_name;
const userLocation = { longitude: userLon, latitude: userLat };
searchInput.property(“value”, displayName);
removeUserMarker();
addUserMarker(userLocation);
const coords = projection([userLon, userLat]);
let mapPanningMessage = “”;
if (coords) {
svg.transition().duration(750).call(
zoom.transform,
d3.zoomIdentity.translate(width / 2, height / 2).scale(4).translate(-coords[0], -coords[1])
);
} else {
mapPanningMessage = ” (Map panning only available for mainland US)”;
}
const nearest = findNearestWarehouse(userLocation, mainlandPoints.concat(puertoRicoPoints));
const locationSpan = `📍 `;
const warehouseSpan = `🚚 `;
let warehouseText = “No nearby warehouses found.”;
if (nearest) {
const distance = calculateDistance(userLat, userLon, nearest.warehouse.latitude, nearest.warehouse.longitude);
const warehouseType = nearest.warehouse.type.toLowerCase();
const warehouseName = nearest.warehouse.company;
warehouseText = `Nearest ${warehouseType} warehouse: ${warehouseName} (${distance.toFixed(1)} miles away)`;
highlightWarehouse(nearest.warehouse);
}
const locationString = `${locationSpan}Searched location: ${displayName}${mapPanningMessage}`;
const finalHtml = `${locationString}
${warehouseSpan}${warehouseText}`;
searchResults.html(finalHtml);
}
searchInput.on(“input”, function() {
const query = searchInput.property(“value”).trim();
fetchSuggestions(query).catch(error => console.error(“Error in fetchSuggestions call:”, error));
});
d3.select(document).on(“click”, function(event) {
const target = event.target;
const isInput = target === searchInput.node();
const isSuggestion = suggestionsList.node().contains(target);
if (!isInput && !isSuggestion) {
hideSuggestions();
}
});
searchButton.on(“click”, handleSearch);
searchInput.on(“keypress”, function(event) {
if (event.key === “Enter”) {
event.preventDefault();
handleSearch();
}
});
function calculateDistance(lat1, lon1, lat2, lon2) {
const R = 3958.8; // Radius of the Earth in miles
const dLat = (lat2 – lat1) * Math.PI / 180;
const dLon = (lon2 – lon1) * Math.PI / 180;
const a =
Math.sin(dLat / 2) * Math.sin(dLat / 2) +
Math.cos(lat1 * Math.PI / 180) * Math.cos(lat2 * Math.PI / 180) *
Math.sin(dLon / 2) * Math.sin(dLon / 2);
const c = 2 * Math.atan2(Math.sqrt(a), Math.sqrt(1 – a));
return R * c; // Distance in miles
}
function findNearestWarehouse(userLocation, warehouses) {
let minDistance = Infinity;
let nearestWarehouse = null;
warehouses.forEach(warehouse => {
if (!isNaN(warehouse.latitude) && !isNaN(warehouse.longitude)) {
const distance = calculateDistance(userLocation.latitude, userLocation.longitude, warehouse.latitude, warehouse.longitude);
if (distance d.company === warehouse.company && d.address === warehouse.address);
if (!dot.empty()) {
const currentScale = d3.zoomTransform(svg.node()).k || 1;
dot.raise()
.classed(“highlighted”, true)
.transition()
.duration(300)
.attr(“r”, baseDotRadius * 1.5 / currentScale)
.style(“stroke”, “var(–color-user-location)”)
.style(“stroke-width”, 2 / currentScale);
}
}
function resetMap() {
svg.transition().duration(750).call(zoom.transform, d3.zoomIdentity);
searchInput.property(“value”, “”);
searchResults.text(“”);
hideSuggestions();
removeUserMarker();
g.selectAll(“.eto-national-map__location-dot.highlighted”)
.classed(“highlighted”, false)
.transition()
.duration(200)
.style(“stroke”, “white”)
.attr(“r”, baseDotRadius / (d3.zoomTransform(svg.node()).k || 1))
.style(“stroke-width”, baseStrokeWidth / (d3.zoomTransform(svg.node()).k || 1));
}
d3.select(“#reset-view”).on(“click”, resetMap);
} catch (error) {
console.error(“Error drawing map:”, error);
d3.select(“.eto-national-map__loading”).text(“Error loading map data. Please try again later.”);
}
}
function zoomed(event) {
const { transform } = event;
g.attr(“transform”, transform);
g.selectAll(“.eto-national-map__location-dot.mainland”)
.attr(“r”, baseDotRadius / transform.k)
.style(“stroke-width”, baseStrokeWidth / transform.k);
g.selectAll(“.eto-national-map__state-borders”)
.style(“stroke-width”, baseStrokeWidth / transform.k);
g.selectAll(“.eto-national-map__country-outline”)
.style(“stroke-width”, baseStrokeWidth / transform.k);
g.select(“#user-location-marker”)
.attr(“r”, 8 / transform.k)
.attr(“stroke-width”, 1.5 / transform.k);
g.selectAll(“.eto-national-map__location-dot.highlighted”)
.attr(“r”, baseDotRadius * 1.5 / transform.k)
.style(“stroke-width”, 2 / transform.k);
}
function showTooltip(event, d) {
const mapContainer = document.querySelector(‘.eto-national-map__container’).getBoundingClientRect();
const tooltipWidth = window.innerWidth <= 768 ? 260 : 250;
const tooltipHeight = window.innerWidth mapContainer.width) {
tooltipX = mouseX – tooltipWidth – tooltipOffset;
}
if (tooltipY + tooltipHeight > mapContainer.height) {
tooltipY = mouseY – tooltipHeight – tooltipOffset;
}
tooltipX = Math.max(10, Math.min(mapContainer.width – tooltipWidth – 10, tooltipX));
tooltipY = Math.max(10, Math.min(mapContainer.height – tooltipHeight – 10, tooltipY));
const tooltipContent = `
${d.company}
Address: ${d.address}
State: ${d.state}
Status: ${d.type}
`;
tooltip
.style(“left”, `${tooltipX}px`)
.style(“top”, `${tooltipY}px`)
.html(tooltipContent)
.classed(“visible”, true)
.style(“opacity”, 1);
}
function hideTooltip() {
tooltip.classed(“visible”, false).style(“opacity”, 0);
}
drawMap();
}
if (document.readyState === ‘loading’) {
document.addEventListener(‘DOMContentLoaded’, initMap);
} else {
initMap();
}
Grist identified the country’s top medical device manufacturers and distributors, including Cardinal Health, Medline, Becton Dickinson, and Owens & Minor, and collated a list of the more than 100 known warehouses that they own or use. Some of these companies have reported to state or federal regulators that they operate at least one distribution center that stores products sterilized with ethylene oxide. Others were identified in person by Grist reporters as recipients of products from sterilization facilities. But since companies use multiple sterilization methods, it’s unclear whether each of these emits ethylene oxide. However, Grist still chose to publish the information to demonstrate the scale of the potential problem: There are almost certainly dozens, if not hundreds, more warehouses than the 30 we are certain about — and thousands more workers unknowingly exposed to ethylene oxide.
Identifying these warehouses and the 30 or so that emit some amount of ethylene oxide was a laborious process, in part because information about these facilities isn’t readily available. Grist reporters staked out sterilization facilities, spoke to truck drivers and warehouse workers, and combed through property databases.
The problem is “much bigger than we all assume,” said Rick Peltier, a professor of environmental health sciences at the University of Massachusetts. “The lack of transparency of where these products go makes us worried.”
At the El Paso warehouse behind Dominguez’s house, Grist spoke to several Cardinal employees who had little knowledge of the risks of being exposed to ethylene oxide. Cardinal Health, which employs a largely Latino workforce at the warehouse, requires some laborers to wear monitors and keep windows and vents open for circulation. But the workers Grist spoke to were unsure what the company is monitoring for.
“I think it’s because of a kind of gas that we are breathing,” one material handler told Grist while on break. “I don’t know what it’s called.”
In response to the list of Cardinal warehouses that Grist identified, a spokesperson noted in a brief comment that the “majority of addresses you have listed are not even medical facilities” and that “the majority of the locations you’ve listed aren’t relevant to the topic you’re focused on.” However, the company did not provide specific information, and the warehouse locations were corroborated against materials available on the company’s website.
Cardinal’s operations extend across the U.S.-Mexico border. The company runs a manufacturing plant in Ciudad Juárez, Mexico, where gauze, surgical gowns, drape sheets, scalpels, and other medical equipment are packaged into kits that provide “everything a doctor needs” to conduct a surgery, as one worker put it. The finished kits are trucked back to El Paso or to New Mexico, where they’re sterilized with ethylene oxide by third-party companies that Cardinal contracts with. Then, the products are trucked to one of the two Cardinal warehouses in El Paso, where they remain until they’re shipped to hospitals across the country. All along the way, in the trucks that transport them and the warehouses that store them, ethylene oxide releases from the surface of the sterilized devices, a process called off-gassing.
The U.S. Environmental Protection Agency regulates the facilities where medical devices are sterilized, controlling the processes and safety protocols to keep ethylene oxide emissions to safe levels. But for myriad reasons, the federal government — and the vast majority of states — has turned a blind eye to warehouses. That’s despite the fact that these storage centers sometimes release more ethylene oxide and pose a greater risk than sterilization facilities. Georgia regulators found that was the case in 2019, and a Grist analysis found the warehouse in Dominguez’s backyard posed a greater threat than the New Mexico sterilization facility that Cardinal receives products from.

Ivan Pierre Aguirre / Grist

Ivan Pierre Aguirre / Grist
“The EPA knows that the risks from ethylene oxide extend far beyond the walls of the sterilization facility,” said Jonathan Kalmuss-Katz, a lawyer at the environmental nonprofit Earthjustice who works on toxic chemicals, “that the chemical remains with the equipment when it is taken to a warehouse, and that it continues to be released, threatening workers and threatening surrounding communities.
“EPA had a legal obligation to address those risks,” he added.
In 2009, Cardinal Health reached out to the Texas Commission on Environmental Quality, or TCEQ, the state environmental regulator, seeking permits for its ethylene oxide emissions. At the time, the chemical compound was not known to be as toxic as it is, and TCEQ officials asked few questions about the effect the emissions would have on residents nearby. Grist’s reporting indicates the company had no legal responsibility to inform state officials but appears to have done so as a responsible actor.
The company’s applications included a rudimentary diagram of a truck pulling up to a warehouse, an arrow pointing up into the air to denote ethylene oxide emissions from the facility, and a truck pulling out of the warehouse. “Due to the unloading of the tractor trailers, Cardinal Health is registering the fugitive EtO that escapes upon the opening of each of the tractor trailers,” it noted, using an abbreviation for ethylene oxide.
To calculate how much of the chemical escaped from trucks carrying sterilized products, Cardinal Health used an EPA model developed for wastewater treatment systems at TCEQ’s direction and multiplied the estimate by the number of trucks it expected would drop off products every year. It’s unclear why the agency instructed Cardinal Health to use a wastewater model for an air pollutant when alternatives existed, but these imprecise calculations led the company to figure that its warehouses emitted at least 479 pounds per year. TCEQ granted Cardinal’s permits without requiring the company to take measures to reduce the pollution or notify residents.
Four years later, the company appears to have made an effort to determine more precise calculations. In a 2013 experiment, the company fit blowers to a truck and measured the amount of ethylene oxide emitted — but withheld other relevant details, like when the measurements were taken and how many products the truck transported, from the documents it submitted to TCEQ. Cardinal found that, in the first five minutes after a truck pulls into the warehouse, the sterilized products off-gas ethylene oxide at their highest levels. But after five minutes, rather than dropping to zero, the off-gassing levels stayed steady at 7 parts per million for the next two hours.
Jesse Nichols / Parker Ziegler / Grist
const link = document.createElement(“link”);
link.rel = “stylesheet”;
link.crossOrigin = “”;
link.href =
“https://grist.nyc3.cdn.digitaloceanspaces.com/eto-pt3/dist/assets/index-B1T_-iQ0.css”;
document.head.appendChild(link);
Publicly available documents do not provide details about where the trucks were coming from, how many packages they held, or how long ago the products had been sterilized — crucial details that determine the rate at which ethylene oxide off-gases. If the medical devices in the truck that Cardinal observed traveled a short distance or if the truck was mostly empty when the experiment was conducted, the company could have vastly underestimated the emissions.
“The numbers they’re using are just science fiction,” said Peltier. “For something as powerful as a carcinogen like this, we ought to do better than making up numbers and just doing some hand-waving in order to demonstrate that you’re not imposing undue risk to the community.”
What’s more, the analyses did not take into account the ethylene oxide emissions once the products were moved inside Cardinal’s facilities.
Toxicologists have long identified ethylene oxide as a dangerous chemical. In 1982, the Women’s Occupational Health Resource Center at Columbia University published a series of fact sheets educating workers about the chemical, and in 1995, the Library of Congress released a study on the risks of using the gas to fumigate archival materials. However, it wasn’t until 2016 that the EPA updated ethylene oxide’s toxicity value, a figure that defines the probability of developing cancer if exposed to a certain amount of a chemical over the course of a lifetime. That year, the agency published a report reevaluating ethylene oxide utilizing an epidemiological study of more than 18,000 sterilization facility workers. The agency’s toxicologists determined the chemical to be 30 times more toxic to adults and 60 times more toxic to children than previously known.
Ethylene Oxide Facts
Ethylene oxide, they determined, was one of the most toxic federally regulated air pollutants. Prolonged exposure was linked to elevated rates of lymphoma and breast cancer among the workers. In one study of 7,576 women who had spent at least one year working at a medical sterilization facility, 319 developed breast cancer. According to an analysis by the nonprofit Union of Concerned Scientists, roughly 14 million people in the U.S. live near a medical sterilization facility.
As a result of the EPA’s new evaluation, companies throughout the country came under greater scrutiny, with some sterilizers experiencing more frequent inspections. But regulators in Texas disputed the EPA’s report. In 2017, eight years after Cardinal Health’s first permit, officials with the TCEQ launched its own study of the chemical and set a threshold for ethylene oxide emissions that was 2,000 times more lenient than the EPA’s, setting off a legal battle that is still playing out in court. For warehouses, which do not receive federal scrutiny, TCEQ’s lenient attitude meant virtually no oversight.
By early 2020, people around the world had little energy for anything but the COVID-19 pandemic. And yet, the spike in demand for sterilized medical devices — and now masks — meant that more trucks with more materials passed through warehouses like the one just beyond Dominguez’s backyard.
To approximate how high her family’s exposure was to ethylene oxide during this period, Grist asked an expert air modeler to run Cardinal Health’s stated emissions through a mathematical model that simulates how pollution particles disperse throughout the atmosphere. (This same model is used by the EPA and companies — including Cardinal — during the permitting process.) Grist collected the emissions information from permit files the company had submitted to the state.
The results indicated that ethylene oxide concentrations on Dominguez’s block amounted to an estimated cancer risk of 2 in 10,000; that is, if 10,000 people are exposed to that concentration of ethylene oxide over the course of their lives, you could expect two to develop cancer from the exposure.
.cardinal-vanessa-container {
max-width: 1200px;
margin-top: 25px;
padding: 0;
font-family: ‘Basis Grotesque’, Arial, sans-serif;
overflow-x: hidden;
}
.cardinal-vanessa-container * {
box-sizing: border-box;
}
.cardinal-vanessa-map-container {
position: relative;
width: 100%;
margin-bottom: 10px;
}
.cardinal-vanessa-map-image {
width: 100%;
height: auto;
display: block;
}
.cardinal-vanessa-annotation {
position: absolute;
pointer-events: none;
z-index: 10;
}
.cardinal-vanessa-annotation-text {
color: white;
font-size: 16px;
text-shadow: 1px 1px 3px rgba(0, 0, 0, 0.8);
white-space: normal;
max-width: 150px;
line-height: 1.2;
}
.cardinal-vanessa-arrow {
position: absolute;
z-index: 5;
}
.cardinal-vanessa-scale-bar {
position: absolute;
bottom: 20px;
right: 20px;
color: white;
font-size: 14px;
text-shadow: 1px 1px 3px rgba(0, 0, 0, 0.8);
display: flex;
flex-direction: column;
align-items: flex-end;
}
.cardinal-vanessa-scale-line {
height: 2px;
background-color: white;
margin-top: 2px;
box-shadow: 1px 1px 3px rgba(0, 0, 0, 0.8);
}
.cardinal-vanessa-map-footer {
display: flex;
justify-content: space-between;
align-items: flex-end;
width: 100%;
}
.cardinal-vanessa-source-container {
color: #3c3830;
font-size: 12px;
text-align: left;
font-style: italic;
font-weight: bold;
}
.cardinal-vanessa-source-line {
margin-bottom: 3px;
}
.cardinal-vanessa-risk-legend {
color: #3c3830;
display: flex;
flex-direction: column;
align-items: flex-end;
}
.cardinal-vanessa-risk-title {
font-size: 14px;
text-align: right;
margin-bottom: 5px;
}
.cardinal-vanessa-risk-scale {
display: flex;
justify-content: flex-end;
align-items: flex-start;
margin-top: 5px;
width: auto;
}
.cardinal-vanessa-risk-level {
text-align: center;
font-size: 10px;
width: 40px;
margin-left: 0;
}
.cardinal-vanessa-risk-color {
width: 100%;
height: 20px;
display: block;
margin-bottom: 3px;
border-top: 1px solid #3c3830;
border-bottom: 1px solid #3c3830;
border-left: 1px solid #3c3830;
}
.cardinal-vanessa-risk-level:last-child .cardinal-vanessa-risk-color {
border-right: 1px solid #3c3830;
}
@media (max-width: 768px) {
.cardinal-vanessa-annotation-text {
font-size: 14px;
}
.cardinal-vanessa-map-footer {
flex-direction: row;
align-items: flex-end;
}
.cardinal-vanessa-source-container {
font-size: 10px;
text-align: left;
flex-basis: 40%;
max-width: 40%;
}
.cardinal-vanessa-scale-bar {
font-size: 12px;
}
.cardinal-vanessa-risk-legend {
flex-grow: 1;
}
.cardinal-vanessa-risk-title {
font-size: 12px;
margin-bottom: 4px;
text-align: right;
}
.cardinal-vanessa-risk-scale {
flex-wrap: wrap;
justify-content: flex-end;
}
.cardinal-vanessa-risk-level {
font-size: 9px;
width: 35px;
margin-bottom: 5px;
}
.cardinal-vanessa-risk-color {
width: 100%;
height: 15px;
margin-bottom: 2px;
border-top: 1px solid #3c3830;
border-bottom: 1px solid #3c3830;
border-left: 1px solid #3c3830;
}
}
document.addEventListener(‘DOMContentLoaded’, function() {
const mapContainer = d3.select(‘.cardinal-vanessa-map-container’);
const annotationsContainer = d3.select(‘#annotationsVanessa’);
const mapImageVanessa = d3.select(‘#mapImageVanessa’);
const riskLegendContainer = d3.select(‘#riskLegendVanessa’);
const scaleLine = d3.select(‘.cardinal-vanessa-scale-line’);
const scaleText = d3.select(‘#scaleTextVanessa’);
const annotationsData = [
{
text: “Cardinal Health’s warehouse on Don Haskins Dr.”,
desktop: { position: { x: 29, y: 25 } },
mobile: { position: { x: 13, y: 15 } },
arrowOrigin: ‘bottom’,
arrowEnd: { x: 49.75, y: 46 }
},
{
text: “Vanessa’s block”,
desktop: { position: { x: 50, y: 55 } },
mobile: { position: { x: 50, y: 70 } },
arrowOrigin: ‘top’,
arrowEnd: { x: 53.25, y: 47 }
}
];
const riskLegendData = {
title: “Cancer risk”,
levels: [
{ text: “1 in 1 million”, color: “#D8CFD8” },
{ text: “”, color: “#B5BFBA” },
{ text: “1 in 100,000”, color: “#79AD72” },
{ text: “”, color: “#6BA327” },
{ text: “1 in 10,000”, color: “#569117” }
]
};
function drawElements() {
annotationsContainer.selectAll(‘*’).remove();
riskLegendContainer.selectAll(‘*’).remove();
const mapImageNode = mapImageVanessa.node();
const refElement = mapImageNode.complete ? mapImageNode : mapContainer.node();
const containerWidth = refElement.offsetWidth;
const containerHeight = refElement.offsetHeight;
if (containerWidth === 0 || containerHeight === 0) {
console.warn(“Container dimensions are zero. Cannot draw elements yet.”);
return;
}
const imageWidth = mapImageNode.offsetWidth;
const scaleLineWidth = imageWidth * 0.245;
scaleLine.style(‘width’, `${scaleLineWidth}px`);
const annotations = annotationsContainer.selectAll(‘.cardinal-vanessa-annotation’)
.data(annotationsData)
.enter()
.append(‘div’)
.attr(‘class’, ‘cardinal-vanessa-annotation’)
.each(function(d) {
const isMobile = window.innerWidth d.text);
const arrowSvg = annotationsContainer.append(‘svg’)
.style(‘position’, ‘absolute’)
.style(‘top’, ‘0’)
.style(‘left’, ‘0’)
.style(‘width’, ‘100%’)
.style(‘height’, ‘100%’)
.style(‘pointer-events’, ‘none’)
.style(‘z-index’, ‘5’)
.attr(‘viewBox’, `0 0 ${containerWidth} ${containerHeight}`)
.style(‘overflow’, ‘visible’);
const defs = arrowSvg.append(‘defs’);
defs.append(‘marker’)
.attr(‘id’, ‘arrowheadVanessa’)
.attr(‘markerWidth’, ‘7’)
.attr(‘markerHeight’, ‘5’)
.attr(‘refX’, ‘6’)
.attr(‘refY’, ‘2.5’)
.attr(‘orient’, ‘auto-start-reverse’)
.append(‘polygon’)
.attr(‘points’, ‘0 0, 7 2.5, 0 5’)
.attr(‘fill’, ‘white’)
.attr(‘filter’, ‘drop-shadow(1px 1px 1px rgba(0,0,0,0.7))’);
annotations.each(function(d) {
if (d.arrowOrigin && d.arrowEnd) {
const textElement = this;
const textRect = textElement.getBoundingClientRect();
const containerRect = mapContainer.node().getBoundingClientRect();
const textTopRel = textRect.top – containerRect.top;
const textLeftRel = textRect.left – containerRect.left;
const textWidth = textElement.offsetWidth;
const textHeight = textElement.offsetHeight;
let startX, startY;
const offset = 5;
if (d.arrowOrigin === ‘bottom’) {
startX = textLeftRel + textWidth / 2;
startY = textTopRel + textHeight + offset;
} else {
startX = textLeftRel + textWidth / 2;
startY = textTopRel – offset;
}
const endX = (d.arrowEnd.x / 100) * containerWidth;
const endY = (d.arrowEnd.y / 100) * containerHeight;
const midX = (startX + endX) / 2;
const midY = (startY + endY) / 2;
const vecX = endX – startX;
const vecY = endY – startY;
const dist = Math.sqrt(vecX * vecX + vecY * vecY);
const perpX = -vecY;
const perpY = vecX;
const perpLength = Math.max(Math.sqrt(perpX * perpX + perpY * perpY), 0.1);
const normPerpX = perpX / perpLength;
const normPerpY = perpY / perpLength;
const curveAmount = Math.max(dist * 0.25, 10);
const controlX = midX + normPerpX * curveAmount;
const controlY = midY + normPerpY * curveAmount;
arrowSvg.append(‘path’)
.attr(‘d’, `M ${startX} ${startY} Q ${controlX} ${controlY} ${endX} ${endY}`)
.attr(‘fill’, ‘none’)
.attr(‘stroke’, ‘white’)
.attr(‘stroke-width’, ‘2’)
.attr(‘stroke-linecap’, ’round’)
.attr(‘filter’, ‘drop-shadow(1px 1px 1px rgba(0,0,0,0.7))’)
.attr(‘marker-end’, ‘url(#arrowheadVanessa)’);
}
});
riskLegendContainer.append(‘div’)
.attr(‘class’, ‘cardinal-vanessa-risk-title’)
.text(riskLegendData.title);
const scaleContainer = riskLegendContainer.append(‘div’)
.attr(‘class’, ‘cardinal-vanessa-risk-scale’);
const riskLevels = scaleContainer.selectAll(‘.cardinal-vanessa-risk-level’)
.data(riskLegendData.levels)
.enter()
.append(‘div’)
.attr(‘class’, ‘cardinal-vanessa-risk-level’);
riskLevels.append(‘div’)
.attr(‘class’, ‘cardinal-vanessa-risk-color’)
.style(‘background-color’, d => d.color);
riskLevels.append(‘div’)
.text(d => d.text);
}
const mapImageNode = mapImageVanessa.node();
if (mapImageNode.complete && mapImageNode.naturalWidth > 0) {
drawElements();
} else {
mapImageVanessa.on(‘load’, drawElements);
mapImageVanessa.on(‘error’, () => {
console.error(“Map image failed to load.”);
});
}
let resizeTimer;
d3.select(window).on(‘resize’, () => {
clearTimeout(resizeTimer);
resizeTimer = setTimeout(drawElements, 250);
});
});
The EPA has never been perfectly clear about what cancer risk level it deems acceptable for the public to shoulder. Instead, it has used risk “benchmarks” to guide decisions around the permitting of new pollution sources near communities. The lower bound in this spectrum of risks is 1 in 1 million, a level above which the agency has said it strives to protect the greatest number of people possible. On the higher end of the spectrum is 1 in 10,000 — a level that public health experts have long argued is far too lax, since a person’s cancer risk from pollution exposure accumulates on top of the cancer risk they already have from genetics and other environmental factors. The risk for Dominguez and her family is just beyond even that.
According to the air modeler’s results, 603,000 El Paso residents, about 90 percent of the city’s population, are exposed to a cancer risk above 1 in 1 million just from Cardinal Health’s two warehouses. More than 1,600 people — including many of Dominguez’s neighbors — are exposed to levels above EPA’s acceptability threshold of 1 in 10,000. The analysis also estimated that the risk from Cardinal Health’s warehouse is higher than that of a Sterigenics medical sterilization facility, located just 35 miles away in Santa Teresa, New Mexico. These findings underscore how much ethylene oxide can accumulate in the air simply from off-gassing. To be clear, these figures are based on Cardinal’s own data. Given the questions surrounding the company’s estimates, the risk to Dominguez, her neighbors, and the facility’s workers could be higher.
.cardinal-butterfield-container {
max-width: 1200px;
margin-top: 25px;
padding: 0;
font-family: ‘Basis Grotesque’, Arial, sans-serif;
overflow-x: hidden;
}
.cardinal-butterfield-container * {
box-sizing: border-box;
}
.cardinal-butterfield-map-container {
position: relative;
width: 100%;
margin-bottom: 10px;
}
.cardinal-butterfield-map-image {
width: 100%;
height: auto;
display: block;
}
.cardinal-butterfield-annotation {
position: absolute;
pointer-events: none;
z-index: 10;
}
.cardinal-butterfield-annotation-text {
color: white;
font-size: 16px;
text-shadow: 1px 1px 3px rgba(0, 0, 0, 0.8);
white-space: normal;
max-width: 150px;
line-height: 1.2;
}
.cardinal-butterfield-arrow {
position: absolute;
z-index: 5;
}
.cardinal-butterfield-scale-bar {
position: absolute;
bottom: 20px;
right: 20px;
color: white;
font-size: 14px;
text-shadow: 1px 1px 3px rgba(0, 0, 0, 0.8);
display: flex;
flex-direction: column;
align-items: flex-end;
}
.cardinal-butterfield-scale-line {
height: 2px;
background-color: white;
margin-top: 2px;
box-shadow: 1px 1px 3px rgba(0, 0, 0, 0.8);
}
.cardinal-butterfield-map-footer {
display: flex;
justify-content: space-between;
align-items: flex-end;
width: 100%;
}
.cardinal-butterfield-source-container {
color: #3c3830;
font-size: 12px;
text-align: left;
font-style: italic;
font-weight: bold;
}
.cardinal-butterfield-source-line {
margin-bottom: 3px;
}
.cardinal-butterfield-risk-legend {
color: #3c3830;
display: flex;
flex-direction: column;
align-items: flex-end;
}
.cardinal-butterfield-risk-title {
font-size: 14px;
text-align: right;
margin-bottom: 5px;
}
.cardinal-butterfield-risk-scale {
display: flex;
justify-content: flex-end;
align-items: flex-start;
margin-top: 5px;
width: auto;
}
.cardinal-butterfield-risk-level {
text-align: center;
font-size: 10px;
width: 40px;
margin-left: 0;
}
.cardinal-butterfield-risk-color {
width: 100%;
height: 20px;
display: block;
margin-bottom: 3px;
border-top: 1px solid #3c3830;
border-bottom: 1px solid #3c3830;
border-left: 1px solid #3c3830;
}
.cardinal-butterfield-risk-level:last-child .cardinal-butterfield-risk-color {
border-right: 1px solid #3c3830;
}
@media (max-width: 768px) {
.cardinal-butterfield-annotation-text {
font-size: 14px;
}
.cardinal-butterfield-map-footer {
flex-direction: row;
align-items: flex-end;
}
.cardinal-butterfield-source-container {
font-size: 10px;
text-align: left;
flex-basis: 40%;
max-width: 40%;
}
.cardinal-butterfield-scale-bar {
font-size: 12px;
}
.cardinal-butterfield-risk-legend {
flex-grow: 1;
}
.cardinal-butterfield-risk-title {
font-size: 12px;
margin-bottom: 4px;
text-align: right;
}
.cardinal-butterfield-risk-scale {
flex-wrap: wrap;
justify-content: flex-end;
}
.cardinal-butterfield-risk-level {
font-size: 9px;
width: 35px;
margin-bottom: 5px;
}
.cardinal-butterfield-risk-color {
width: 100%;
height: 15px;
margin-bottom: 2px;
border-top: 1px solid #3c3830;
border-bottom: 1px solid #3c3830;
border-left: 1px solid #3c3830;
}
}
document.addEventListener(‘DOMContentLoaded’, function() {
const mapContainer = d3.select(‘.cardinal-butterfield-map-container’);
const annotationsContainer = d3.select(‘#annotationsButterfield’);
const mapImageButterfield = d3.select(‘#mapImageButterfield’);
const riskLegendContainer = d3.select(‘#riskLegendButterfield’);
const scaleLine = d3.select(‘.cardinal-butterfield-scale-line’);
const scaleText = d3.select(‘#scaleTextButterfield’);
const annotationsData = [
{
text: “Cardinal Health’s warehouse on Butterfield Trail Blvd.”,
desktop: { position: { x: 29, y: 25 } },
mobile: { position: { x: 13, y: 15 } },
arrowOrigin: ‘bottom’,
arrowEnd: { x: 51, y: 48 }
}
];
const riskLegendData = {
title: “Cancer risk”,
levels: [
{ text: “1 in 1 million”, color: “#D8CFD8” },
{ text: “”, color: “#B5BFBA” },
{ text: “1 in 100,000”, color: “#79AD72” },
{ text: “”, color: “#6BA327” },
{ text: “1 in 10,000”, color: “#569117” }
]
};
function drawElements() {
annotationsContainer.selectAll(‘*’).remove();
riskLegendContainer.selectAll(‘*’).remove();
const mapImageNode = mapImageButterfield.node();
const refElement = mapImageNode.complete ? mapImageNode : mapContainer.node();
const containerWidth = refElement.offsetWidth;
const containerHeight = refElement.offsetHeight;
if (containerWidth === 0 || containerHeight === 0) {
console.warn(“Container dimensions are zero. Cannot draw elements yet.”);
return;
}
const imageWidth = mapImageNode.offsetWidth;
const scaleLineWidth = imageWidth * 0.145;
scaleLine.style(‘width’, `${scaleLineWidth}px`);
const annotations = annotationsContainer.selectAll(‘.cardinal-butterfield-annotation’)
.data(annotationsData)
.enter()
.append(‘div’)
.attr(‘class’, ‘cardinal-butterfield-annotation’)
.each(function(d) {
const isMobile = window.innerWidth d.text);
const arrowSvg = annotationsContainer.append(‘svg’)
.style(‘position’, ‘absolute’)
.style(‘top’, ‘0’)
.style(‘left’, ‘0’)
.style(‘width’, ‘100%’)
.style(‘height’, ‘100%’)
.style(‘pointer-events’, ‘none’)
.style(‘z-index’, ‘5’)
.attr(‘viewBox’, `0 0 ${containerWidth} ${containerHeight}`)
.style(‘overflow’, ‘visible’);
const defs = arrowSvg.append(‘defs’);
defs.append(‘marker’)
.attr(‘id’, ‘arrowheadButterfield’)
.attr(‘markerWidth’, ‘7’)
.attr(‘markerHeight’, ‘5’)
.attr(‘refX’, ‘6’)
.attr(‘refY’, ‘2.5’)
.attr(‘orient’, ‘auto-start-reverse’)
.append(‘polygon’)
.attr(‘points’, ‘0 0, 7 2.5, 0 5’)
.attr(‘fill’, ‘white’)
.attr(‘filter’, ‘drop-shadow(1px 1px 1px rgba(0,0,0,0.7))’);
annotations.each(function(d) {
if (d.arrowOrigin && d.arrowEnd) {
const textElement = this;
const textRect = textElement.getBoundingClientRect();
const containerRect = mapContainer.node().getBoundingClientRect();
const textTopRel = textRect.top – containerRect.top;
const textLeftRel = textRect.left – containerRect.left;
const textWidth = textElement.offsetWidth;
const textHeight = textElement.offsetHeight;
let startX, startY;
const offset = 5;
if (d.arrowOrigin === ‘bottom’) {
startX = textLeftRel + textWidth / 2;
startY = textTopRel + textHeight + offset;
} else {
startX = textLeftRel + textWidth / 2;
startY = textTopRel – offset;
}
const endX = (d.arrowEnd.x / 100) * containerWidth;
const endY = (d.arrowEnd.y / 100) * containerHeight;
const midX = (startX + endX) / 2;
const midY = (startY + endY) / 2;
const vecX = endX – startX;
const vecY = endY – startY;
const dist = Math.sqrt(vecX * vecX + vecY * vecY);
const perpX = -vecY;
const perpY = vecX;
const perpLength = Math.max(Math.sqrt(perpX * perpX + perpY * perpY), 0.1);
const normPerpX = perpX / perpLength;
const normPerpY = perpY / perpLength;
const curveAmount = Math.max(dist * 0.25, 10);
const controlX = midX + normPerpX * curveAmount;
const controlY = midY + normPerpY * curveAmount;
arrowSvg.append(‘path’)
.attr(‘d’, `M ${startX} ${startY} Q ${controlX} ${controlY} ${endX} ${endY}`)
.attr(‘fill’, ‘none’)
.attr(‘stroke’, ‘white’)
.attr(‘stroke-width’, ‘2’)
.attr(‘stroke-linecap’, ’round’)
.attr(‘filter’, ‘drop-shadow(1px 1px 1px rgba(0,0,0,0.7))’)
.attr(‘marker-end’, ‘url(#arrowheadButterfield)’);
}
});
riskLegendContainer.append(‘div’)
.attr(‘class’, ‘cardinal-butterfield-risk-title’)
.text(riskLegendData.title);
const scaleContainer = riskLegendContainer.append(‘div’)
.attr(‘class’, ‘cardinal-butterfield-risk-scale’);
const riskLevels = scaleContainer.selectAll(‘.cardinal-butterfield-risk-level’)
.data(riskLegendData.levels)
.enter()
.append(‘div’)
.attr(‘class’, ‘cardinal-butterfield-risk-level’);
riskLevels.append(‘div’)
.attr(‘class’, ‘cardinal-butterfield-risk-color’)
.style(‘background-color’, d => d.color);
riskLevels.append(‘div’)
.text(d => d.text);
}
const mapImageNode = mapImageButterfield.node();
if (mapImageNode.complete && mapImageNode.naturalWidth > 0) {
drawElements();
} else {
mapImageButterfield.on(‘load’, drawElements);
mapImageButterfield.on(‘error’, () => {
console.error(“Map image failed to load.”);
});
}
let resizeTimer;
d3.select(window).on(‘resize’, () => {
clearTimeout(resizeTimer);
resizeTimer = setTimeout(drawElements, 250);
});
});
In 2021, Dominguez gave birth to her second child, and over the next few years, both she and her children began suffering from respiratory issues. Her young son, in particular, developed severe breathing problems, and a respiratory specialist prescribed an inhaler and allergy medication to help him breathe better. Her daughter, now a teenager, complained of persistent headaches. And she, too, began developing sinus headaches.
Meanwhile, Cardinal Health was expanding its operations. In 2023, the company applied to the TCEQ for an updated permit “as quickly as possible.” At the warehouse across town from Dominguez, the company soon expected to receive nearly four times as many trucks carrying sterilized products — potentially up to 10,000 trucks a year — and the increased truck traffic “may increase potential emissions” of ethylene oxide.
Cardinal relied on the 2013 experiment to estimate the facility’s emissions, simply multiplying that concentration by the new maximum number of trucks the facility would be permitted to receive. The back-of-the-envelope calculation led the company to estimate that the warehouse across town from Dominguez would increase its emissions to 1,000 pounds of the chemical per year.
Cardinal also estimated that the medical equipment would off-gas 637 pounds of ethylene oxide inside the warehouse every year. However, it claimed that those emissions are “de minimus,” or insignificant sources of pollution. Under Texas state law, minimal emissions, such as the vapors that might form in a janitorial closet storing solvents or gas produced by running air conditioners or space heaters, may be excluded from permitting requirements.
“Like, if I’m a college professor in school, I don’t want to consider the volatile organic compounds coming out of the marker pens that I’m writing with on the board,” said Ron Sahu, a mechanical engineer and consultant with decades of experience working with state and federal environmental regulators and industrial operators. The exceptions, he said, “were not based on highly toxic compounds like ethylene oxide.”
As required under Texas rules, Cardinal surveyed facilities around the country that emit comparable amounts of ethylene oxide and summarized the technology they use to reduce emissions. Given the volume of the emissions from the warehouse, the most analogous facilities were the sterilizers themselves. The company found two sterilizers in Texas that utilize equipment to reduce their emissions by 99 percent.
More from this series
But these options, Cardinal determined, were “cost excessive” and emissions from the warehouse were “very low.” Instead, the company said it would simply “restrict” the number of trucks unloading sterilized products — only three per hour and 10,000 per year. In other words, it would expand its operations, but in a controlled way, in order to forego proven methods of reducing ethylene oxide emissions.
Grist sent TCEQ detailed written questions about the permits it issued to Cardinal. Even though the questions were based on documents the agency has already made publicly available, a spokesperson requested that Grist send a formal records request “due to the level of involvement and the amount of technical information you are requesting.”
Ultimately, in 2023, TCEQ granted Cardinal’s new permit.
At the same time that Cardinal Health was expanding its operations in Texas, the fight to have stricter oversight of ethylene oxide was spreading across the country. Individuals in Lakewood, Colorado, filed private lawsuits for health care damages related to ethylene oxide exposure; others joined class action lawsuits against sterilization companies and the EPA.
Finally, in April 2023, the EPA proposed long-overdue regulations to reduce ethylene oxide emissions from sterilizers. While the draft rule covered emissions from storage centers located on-site, it neglected to include off-site warehouses. Other provisions advocates had hoped for, like mandatory fence-line air monitoring near facilities, were also missing from the draft rule.
Following standard procedure, the EPA then opened a 75-day period for public comment and potential revision to the draft rule. Earthjustice organized a convening of community advocates from across the country to increase pressure on the agency to strengthen its draft. Residents from California, Texas, Puerto Rico, and other places with sterilizers spent two days in Washington, D.C., petitioning members of Congress, meeting with the EPA, and sharing their stories of exposure.
Daniel Savery, a legislative representative at Earthjustice who helped organize the event, told Grist that the meeting with the EPA’s Office of Air and Radiation was well attended and that leadership expressed empathy for the stories they heard. But when the agency released the final rule in March 2024, neither off-site warehouses nor mandatory air monitoring was included. The regulations do reference the problem of off-site warehouses and indicate the agency’s intention to collect information about them — a first step that Savery believes wouldn’t have made it into the rule were it not for pressure from the Washington meetings. However, he added, the EPA should have collected information about medical supply warehouses a long time ago.
“This is the EPA’s eighth rodeo on this issue,” Savery said, alluding to the many years advocates have pressed the agency to address ethylene oxide exposure since the chemical was found to be highly toxic in 2016. The EPA’s Office of Inspector General, an independent agency watchdog, had asked the federal regulators as early as 2020 to do a better job informing the public about their exposure to ethylene oxide from the sterilization industry. “The wool is sort of over the country’s eyes for the most part about these emissions sources,” Savery said.
Efforts to rein in ethylene oxide emissions seem unlikely during President Donald Trump’s second term. Trump’s nominee to lead the EPA’s air quality office, Aaron Szabo, was a lobbyist for the sterilization industry, and the agency recently asked sterilizers seeking an exemption from ethylene oxide rules to send their petitions to a dedicated government email address. The Trump administration has since also said in court filings that it plans to “revisit and reconsider” the rule for sterilizers.
A spokesperson for the EPA said they cannot “speak to the decisions of the Biden-Harris administration” and cited the agency’s recent decision to offer exemptions to sterilizers. The spokesperson also referenced a separate EPA decision to regulate ethylene oxide as a pesticide. That decision “could require a specific study for monitoring data on fumigated medical devices to better understand worker exposure to EtO from fumigated medical devices,” the spokesperson said. However, much like the sterilizer rule, the Trump administration could also decide to rescind the pesticide determination.
“Ethylene oxide from these warehouses is just unregulated,” said Sahu, the mechanical engineer. “There’s no control, so everything will eventually find its way to the ambient air.”
Last August, on a cloudy morning in east El Paso, Texas, when most people’s days were just getting started, workers at the Cardinal Health warehouse were sitting in their cars, a stone’s throw from the Dominguez backyard. Having started their shifts at 5 a.m., they were all on break. One young worker was talking to his girlfriend. Another was scrolling on Facebook. And another snacked on Takis, staining her fingers bright red.
Some of their jobs require moving refrigerator-size pallets filled with sterilized medical devices. Others carefully cut open the pallets wrapped in plastic, moving the cardboard boxes containing the medical kits into the warehouse and repackaging them to be trucked to hospitals across the country. They do this with protective gloves, basic face masks, and hairnets — precautions the company urges to ensure the sterility of the medical equipment, not the protection of the workers.
Grist spoke to several of them while they were on break or leaving their shifts. Although none of the workers agreed to speak with Grist reporters on the record, due to a fear of retaliation by their employer, they shared their experiences about working at the warehouse. Most were unaware they were being exposed to ethylene oxide. Some had heard of the chemical but didn’t know the extent of their exposure and its risks.
Grist also distributed flyers to workers and nearby residents explaining the risks of ethylene oxide exposure. Two workers called Grist using the contact number on the flyer and said they had developed cancers that research links to ethylene oxide exposure after they started the job.
Since learning about the warehouse’s emissions, Dominguez said she now thinks twice before letting her young son play in the backyard. “We’re indoors most of the time for that reason,” she said.
Dominguez had been considering buying the property from her boss, but her family’s future in their home is now uncertain.
“I really changed my mind about that,” she said.
Editor’s note: Earthjustice is an advertiser with Grist. Advertisers have no role in Grist’s editorial decisions.
We created an informational guide — available in English and Spanish — in collaboration with community organizations, nonprofits, and residents who have pushed for more EtO regulation for years. This booklet contains facts about EtO, as well as ways to get local officials to address emissions, legal resources you can reference, and more. You can view, download, print, and share it here.
If you’re a local journalist or a community member who wants to learn more about how we investigated this issue and steps you can take to find out more about warehouses in your area, read this.
This story was originally published by Grist with the headline The unregulated link in a toxic supply chain on Apr 16, 2025.
]]>
66253824
https://grist.org/international/why-the-shipping-industrys-new-carbon-tax-is-a-big-deal-and-still-not-enough/
Wed, 16 Apr 2025 08:30:00 +0000
https://grist.org/?p=663165
<
Nicolas Tucat / AFP via Getty Images
In 2018, the IMO set an intention to halve net-zero greenhouse gas emissions by 2050, using 2008 levels as a baseline. It updated that goal in 2023, shooting for net-zero “by or around, i.e., close to, 2050,” while also setting an interim target of cutting emissions by 20 to 30 percent by 2030. Last week’s meeting was part of the IMO’s work to develop a “basket of measures” to achieve those benchmarks and more forcefully transition the sector away from heavy fuel oil, a particularly carbon-intensive fuel that makes up the bulk of large ships’ energy source.
Many environmental groups and island countries — which are more vulnerable to climate-driven sea level rise — had hoped that the IMO would implement a straightforward tax on all shipping emissions, with revenue directed broadly toward climate mitigation and adaptation projects in their regions.
That’s not quite what happened. Instead, the agreed-upon policy creates a complex mechanism to charge shipping companies for a portion of their vessels’ climate pollution, on the basis of their emissions intensity: the amount of climate pollution they emit per unit of energy used. The mechanism includes two intensity targets, which become more stringent over time. One is a “base target,” a minimum threshold that all ships are supposed to meet. The other is more ambitious and is confusingly dubbed a “direct compliance target.”
Ships that meet the more stringent target are the most fuel efficient. Based on how much cleaner they are than the target, their operators are awarded a credit they can sell to companies with less efficient boats. They can also bank these credits for use within the following two years, in case their performance dips and they need to make up for it.
Vessels that don’t quite meet the stricter standard but are more efficient than the base target don’t get a reward. They must pay for their deficit below the direct compliance target with “remedial units” at a price of $100 per metric ton of CO2 equivalent.
Those that are below both targets have to buy remedial units to make up for the full amount of space between them. On top of that, they also have to buy a number of even more expensive units ($380 per ton of CO2 equivalent), based on how much less efficient than the base target they are. They can cover their shortfall with any credits they’ve banked, or by buying them from carriers with more efficient ships.
Courtesy of Nishatabbas Rehmatulla
Revenue raised from this system will go into a “net-zero fund,” which is intended to help pay for further decarbonization of the shipping sector, including the development of low- and zero-emissions fuels. A portion of this fund is explicitly intended to help poor countries and island states with fewer resources to make this transition.
The strategy was approved by a vote — an uncommon occurrence in intergovernmental fora where decisions are usually made by consensus. Rehmatulla said the IMO has only held a vote like this once before, 15 years ago.
Sixty-three countries voted in favor of the measures, and 16 opposed. Another two dozen, including many small island states like Fiji and Tuvalu, chose to abstain. Tuvalu’s transport minister, Simon Kofe, told Climate Home News that the agreement “lacks the necessary incentives for industry to make the necessary shift to cleaner technologies.” Modeling by University College London suggests that the new pricing mechanism will only lead to an 8 to 10 percent reduction in shipping’s climate pollution by 2030, a far cry from the agency’s own goal of 20 to 30 percent.
Leaders from other island nations, as well as climate advocates, also objected to restrictions on the net-zero fund that suggest it will only be used to finance shipping decarbonization; they wanted the fund to be available for climate mitigation and adaptation projects in any sector. In order to transition away from fossil fuels and safeguard themselves from climate disasters, developing countries need trillions of dollars more than what’s currently coming to them from the world’s biggest historical emitters of greenhouse gases.
A climate minister from Vanuatu, Ralph Regenvanu, said in a statement the U.S., Saudi Arabia, and other oil-producing countries had “blocked progress” at the IMO talks, and that they had “turned away a proposal for a reliable source of revenue for those of us in dire need of finance to help with climate impacts.”
University College London research also suggests that, while the system will make it too expensive to build new boats reliant on liquefied natural gas — a fossil fuel that drives climate change — it will not raise enough revenue to finance the development of zero- and near-zero-carbon shipping technologies like green ammonia. (Lower shipping speeds and wind propulsion — also known as sails — can also reduce shipping emissions).
The United States did not participate in the negotiations. Its delegation left on day two, calling the proposed regulations “blatantly unfair” and threatening to retaliate with “reciprocal measures” if the IMO approved measures to restrict greenhouse gas emissions.
The International Chamber of Shipping welcomed the agreement, saying it would level the playing field and give companies more confidence to decarbonize their fleets. “We are pleased that governments have understood the need to catalyse and support investment in zero-emission fuels, and it will be fundamental to the ultimate success of this IMO agreement that it will quickly deliver at the scale required,” said a statement from Guy Platten, the group’s secretary general.
Antonio Santos, federal climate policy director for the nonprofit Pacific Environment, said the agreement was “momentous,” although he shared the disappointment of many small island states over its lack of ambition. “What was agreed to today is the floor,” he told Grist. “It’s lower than we would have wanted, but at least it sets us in a positive direction.”
Revisions to the strategy are expected every five years, potentially leading to higher carbon prices and other measures to quicken decarbonization. But Santos said significant additional investment from governments and the private sector will still be needed.
IMO member states will reconvene in October to formally adopt the new regulations. Over the following 16 months, delegates will figure out how to implement the rules before they are finally entered into force in 2027.
toolTips(‘.classtoolTips3′,’Carbon dioxide, methane, nitrous oxide, and other gases that prevent heat from escaping Earth’s atmosphere. Together, they act as a blanket to keep the planet at a liveable temperature in what is known as the “greenhouse effect.” Too many of these gases, however, can cause excessive warming, disrupting fragile climates and ecosystems.’); toolTips(‘.classtoolTips4′,’The process of reducing the emission of carbon dioxide and other greenhouse gases that drive climate change, most often by deprioritizing the use of fossil fuels like oil and gas in favor of renewable sources of energy.’);
This story was originally published by Grist with the headline Why the shipping industry’s new carbon tax is a big deal — and still not enough on Apr 16, 2025.
]]>
6631658
https://grist.org/energy/cwip-energy-policies-are-back/
Wed, 16 Apr 2025 08:15:00 +0000
https://grist.org/?p=663027
<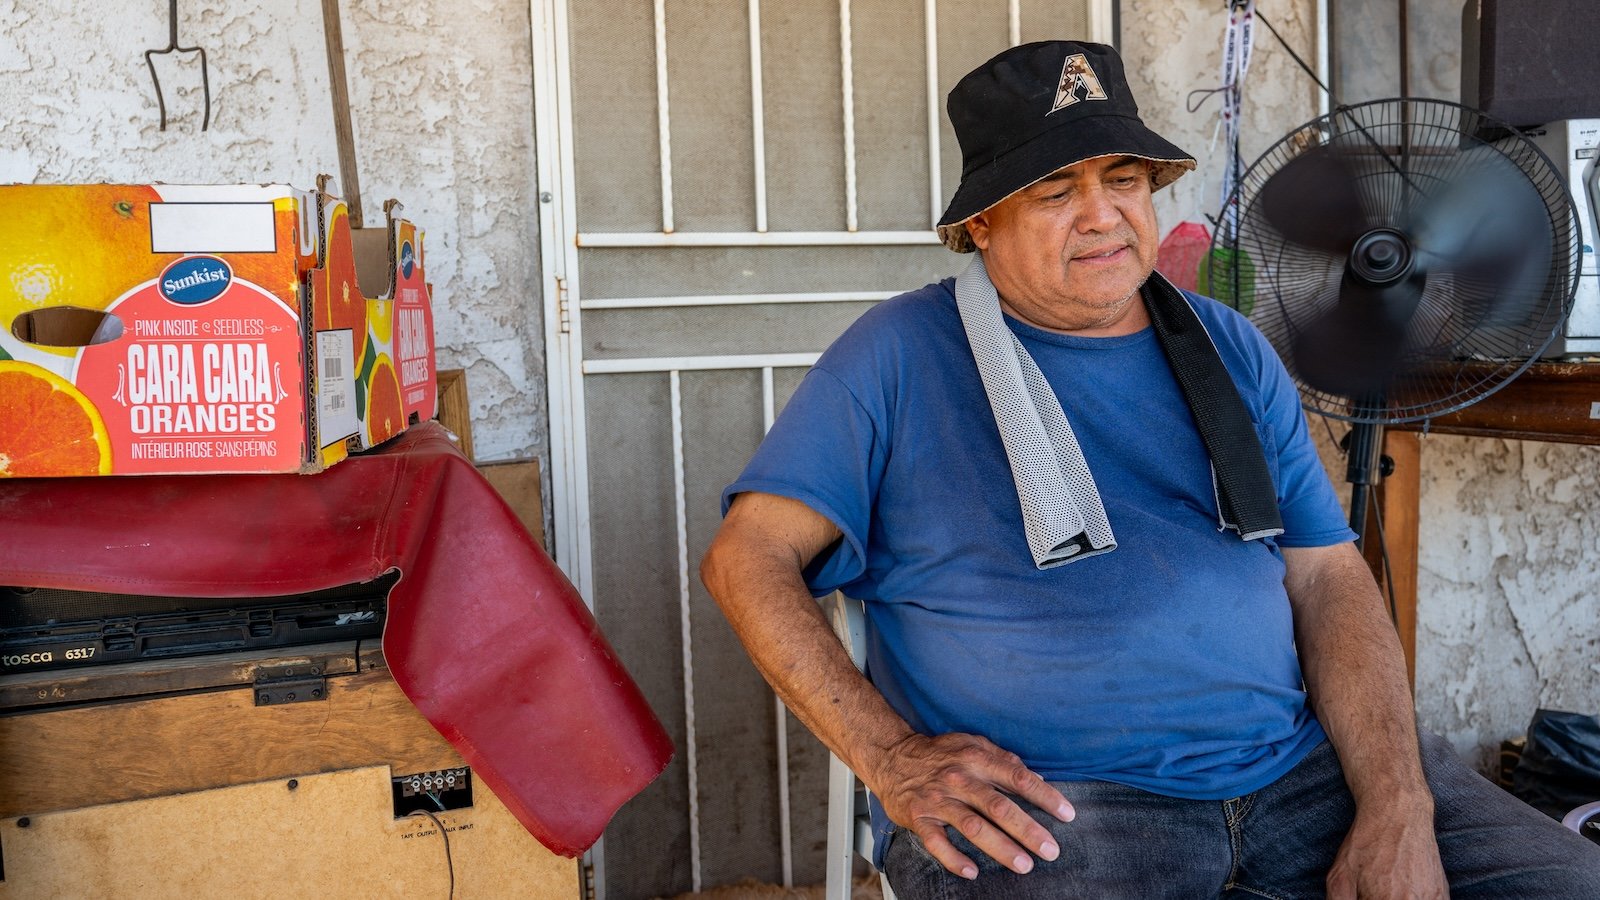
CWIP laws first emerged in the 1970s, during a period in which utility companies made the case to legislatures that they needed an alternative model of financing in order to contend with then-rising costs of power-plant construction and predicted growth in power demand, said Ari Peskoe, an expert in electricity law at Harvard Law School. “And then it turned out that the demand just didn’t materialize, for a number of reasons. Electricity demand was increasing like 8 to 10 percent a year, and then it went down to like 3 percent a year.”
This put states where nuclear projects broke ground and then were abandoned in the position of having to answer the difficult question of whether to charge ratepayers for the incomplete work. Those states where CWIP laws had been passed, however, were in a different position: “If you already had CWIP, if you had already been collecting a significant amount of these costs, it changes the calculus, because now ratepayers aren’t going to get that money back. They’ve already paid the billion dollars,” Peskoe said.
A subsequent wave of CWIP policies occurred in the early 2000s. A 2017 investigation by The Post and Courier found that CWIP and similar policies passed in 11 states “ignited a bonfire of risky spending” and financed three of the last decade’s most spectacular energy boondoggles: the Kemper Project, a failed $7.5 billion “clean coal” facility in Mississippi; the V.C. Summer expansion project, a failed $9 billion nuclear plant in South Carolina; and Units 3 and 4 at Plant Vogtle — a pair of nuclear reactors in Georgia which did actually get built, but seven years past their deadline and $17 billion over their original budget.
When a CWIP-financed project goes south, ratepayers have little practical guarantee that they can get their money back, said Daniel Tait, a researcher at the Energy and Policy Institute. “In the case of Mississippi, with Kemper, they did end up taking that money back and charging shareholders, only after lawsuits basically documenting fraud. V.C. Summer did not; even though people went to jail for fraud, customers are still paying for that to this day in South Carolina,” Tait said.
Amid the current crop of CWIP bills, all in Republican-dominated legislatures, one state provides something of a cautionary tale: A bill in the Ohio legislature aims to reverse a prior CWIP policy. The bill comes in the wake of a massive utility bribery scandal that landed the former speaker of the Ohio House of Representatives in prison.
Audits of the bribes paid to politicians in that scandal found that the power company FirstEnergy “capitalized a portion of this money as construction work in progress, even though it had nothing to do with building things,” said Dave Anderson, a researcher at the Energy and Policy Institute. “And it’s kind of still sitting on their books, waiting to be potentially collected from rate payers.”
Some of the recent CWIP bills are more protective of ratepayers than others, and they apply to different generation methods. But despite their differences, all of the bills come at a time when America’s electricity demand is projected to grow dramatically over the next few years because of the expansion of AI. Many states are competing to lure data centers with tax breaks (and with policies like CWIP), while others have so many data centers already planning to break ground that they are desperately augmenting their states’ power grids to accommodate the demand that utilities say is coming.
Crucially, though, there is significant uncertainty around the amount of load growth that will actually materialize from AI. Power companies have limited insight into how much more electricity generation they will actually need to build for, and if they overshoot or undershoot, someone will be stuck with the bill. Who pays for the risk of such a costly error is a consequential question.
“If you have a bunch of prospective load growth, there’s risk on two fronts: One, that it shows up and you’re using mechanisms like CWIP that essentially use captive ratepayers as the piggy bank for the benefit of others that are not paying their fair share,” said Tait, citing the example of a Meta data center in Louisiana whose costs advocates have raised concerns are being passed on to Entergy ratepayers. “The second is, what happens if the load doesn’t show up, the customers have already paid for it, and there’s no way out?”
CWIP policies could also lock in plans that some environmental advocates say might not be the best way to meet growth in electricity demand. “From an environmental standpoint, we want to have flexibility,” said Joshua Basseches, a professor at Tulane University who studies state-level energy and climate policy. “We don’t want just gas plants; we want to have microgrids and demand response and batteries and all this other stuff. But once you pass CWIP and then you start collecting for a plant that isn’t yet operative, it sort of forecloses other possibilities to meet that load in other ways.”
Those other possibilities would also be less profitable for power companies than the mere construction of capital-intensive power plants of the sort that are incentivized by CWIP policies. And to many observers, these industry-friendly bills are no surprise in light of those companies’ vast political and lobbying power in their respective states. Missouri’s governor has received some $400,000 in campaign donations from utility companies, according to an Energy and Policy Institute analysis. And the legislator who sponsored North Carolina’s CWIP bill, which passed the state senate shortly before his retirement, is a former executive at Duke Energy.
This story was originally published by Grist with the headline The obscure policy that financed many of the last decade’s riskiest energy investments is back on Apr 16, 2025.
]]>
6630278
https://grist.org/cities/chicago-law-would-change-where-polluting-companies-operate/
Wed, 16 Apr 2025 08:00:00 +0000
https://grist.org/?p=662915
<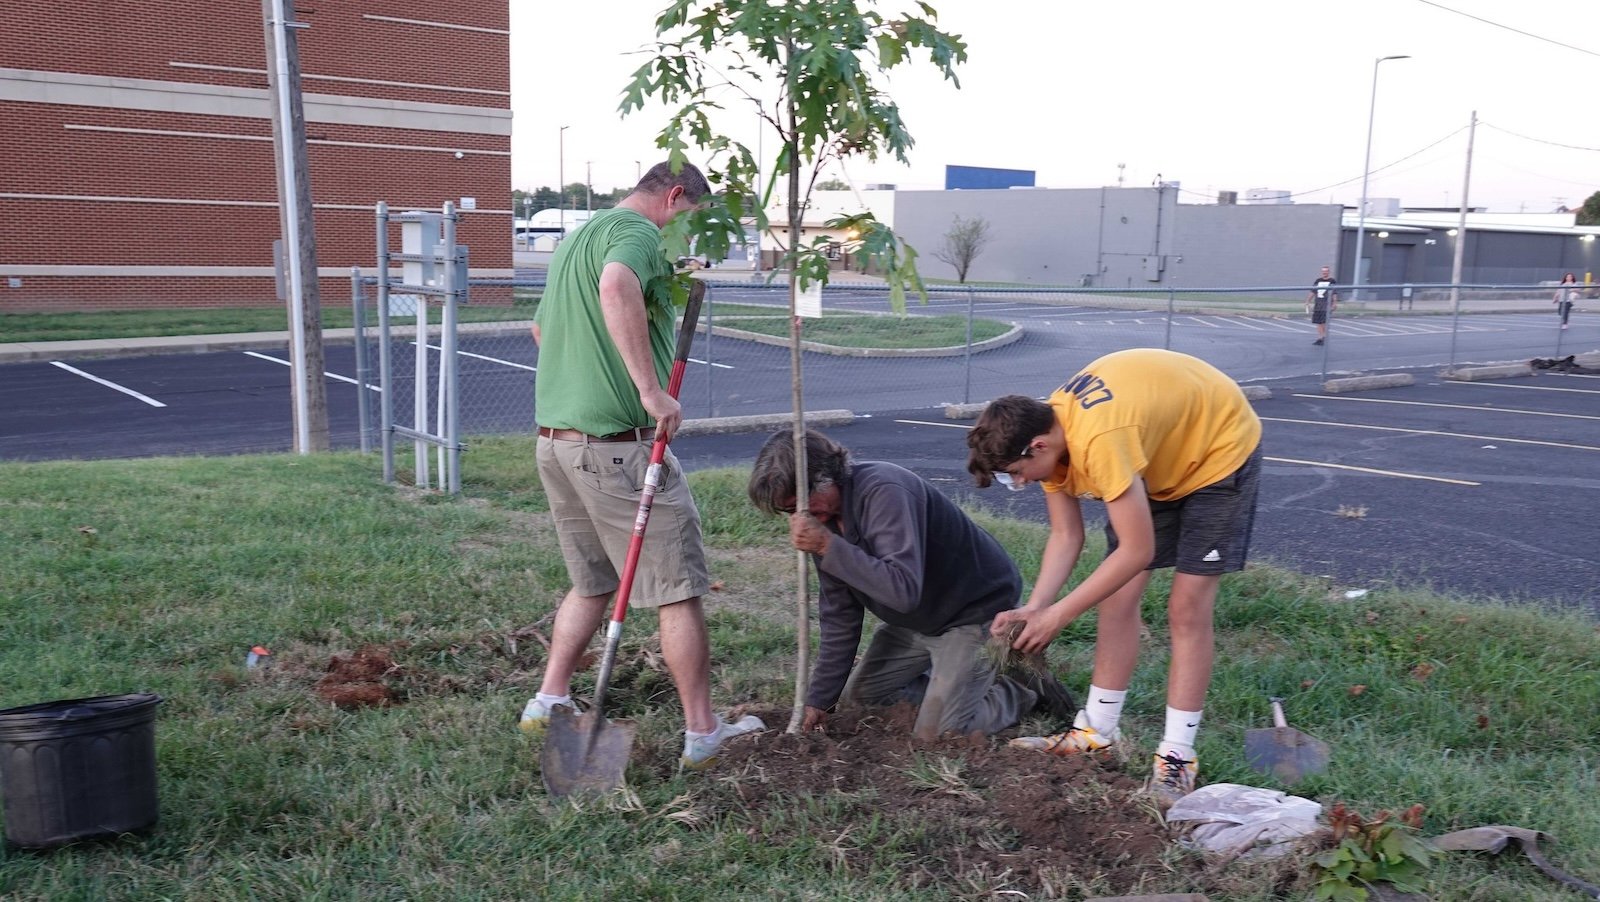
The Chicago ordinance is named after Johnson’s mother, Hazel Johnson, who started fighting in the 1970s for the health of her neighbors at a public housing community surrounded by a “toxic doughnut” of polluters.
Cheryl Johnson runs People for Community Recovery, an organization started by her mother, with the same mission to protect human health. “The most important thing — and the only thing that we get — is good health or bad health,” Johnson said. “That’s what my mother fought for.”
In 2020, Johnson’s group, along with several other local environmental justice organizations, launched a civil rights complaint over the city’s role in the relocation of a metal-shredding operation from its longtime home on the North Side to a majority Black and Latino neighborhood on the far South Side of the city.
An investigation by the U.S. Department of Housing and Urban Development concluded in 2022 that Chicago had long placed polluters in low-income areas, while sparing majority-white affluent neighborhoods.
In a binding agreement with former President Joe Biden’s administration, the city promised to offer a legal fix. Former mayor Lori Lightfoot signed the agreement with HUD hours before she left office in 2023. Her successor, Mayor Brandon Johnson, vowed to follow the agreement and said that September that an ordinance proposal would be offered in short order.
But weeks and months turned into years, and community, health, and environmental advocates complained that the mayor was slow-walking his promises. Nearly two years later, the city is finally set to deliver.
Not all community groups are happy with the proposal. Theresa McNamara, an activist with the Southwest Environmental Alliance, said at a recent public meeting she didn’t think the measure would go far enough. She called it a “weak piece of crap” based on her understanding of the main points.

Experts said the law’s success would depend on the city’s will to execute and enforce it.
“There’s a lot of states and even cities that have assessment tools, but the question is, what do you do with those?” said Ana Baptisa, an environmental policy professor at The New School in New York.
In New Jersey, Baptista helped pass a similar ordinance — then the first of its kind — through the Newark City Council in 2016. Since then, local and state governments across the country have followed suit. At least eight states have passed this type of legislation, including California, Minnesota, New York, and Delaware.
Still, Baptista said Newark’s bill has failed to rein in polluting industries. “It proved to be what we feared: a sort of formality that oftentimes doesn’t even get completed,” she said.
Even without power to deny or constrain new pollution sources, the advisory board itself marks progress, according to Oscar Sanchez, whose Southeast Environmental Task Force helped file the original civil rights complaint,.
Sanchez added that as the federal government retreats from its commitments to environmental justice, state and local entities are on the front line of buffering communities from greater pollution burdens.
“We are pushing the needle of what people can try to achieve in their own communities,” he said.
This story was originally published by Grist with the headline A Chicago law could shift where heavy industry operates — and who bears the burden of pollution on Apr 16, 2025.
]]>
6629155
https://grist.org/sponsored/looking-to-create-effective-climate-change-policy-community-assembly-seattle/
Tue, 15 Apr 2025 14:30:34 +0000
https://grist.org/?p=662941
<
MLK Labor
Assemblies have been implemented across the U.S. and around the world, including in Hawai’i after the onset of the COVID-19 pandemic; in Jackson, Miss., to bring community-based perspectives into the city’s contracting process; and in the Bronx, N.Y., to advocate for stronger policies on housing, economic inequality, and health. While not government-funded or directly initiated with officials, these assemblies create opportunities for deeper collaboration between communities and policymakers.
“This is a model that has always existed — the assembly, a deep form of engagement — and it exists across the globe in different variations, demonstrating how structured public participation can inform policies and decisions that directly impact people’s lives,” said Faduma Fido, Lab Leader with Seattle partner organization People’s Economy Lab.
One thing that distinguishes Washington’s Community Assemblies is that they’re funded by government entities. MLK Labor’s assembly, along with an assembly led by the Urban League of Metropolitan Seattle, were funded by the City of Seattle Office of Sustainability and Environment in partnership with Seattle’s Green New Deal Oversight Board. The oversight board will use recommendations from community assemblies to inform Seattle’s Climate Action Plan update and future climate policies and priorities. With all of this in mind, it was important for the sustainability office and the oversight board to wisely choose the organizations that would lead these community assemblies. The Green New Deal legislation funded this program with $100,000 set aside to invest in participatory decision-making.

Urban League of Metropolitan Seattle
Choosing MLK Labor and the Urban League of Metropolitan Seattle came after lengthy research, according to Elise Rasmussen, Climate and Environmental Justice Associate at Seattle’s sustainability office. Most importantly, both organizations prioritized communities disproportionately affected by climate change.
For MLK Labor’s Community Assembly, this included individual union members who had voiced past concerns about climate change and workers in roles that would put them in the path of extreme weather events. For the Urban League’s, which was focused on community resilience in the face of climate change, participants were chosen for their connection and lived experience to climate change and equity. This group included 25 members from Indigenous communities, as well as other communities of color, immigrants, unhoused people, elders, and youth who were engaged in efforts to fight climate change locally.
In the South Seattle College lecture hall, Hasegawa saw the type of camaraderie common in unions, but this time solidarity formed around facing climate change. “People found that they were not alone in having to deal with extreme weather,” he said, “and [workers were] not being given the tools or the protections from their managers to do what they needed to do.” Firefighters talked about having to work in extreme heat, home health care workers described elderly and vulnerable patients struggling without air conditioning, and teachers detailed sweaty days in classrooms, burst pipes, and mold.

MLK Labor
The point, according to Fido, is to ensure that no one gets left behind in Seattle’s climate planning. Community Assemblies are a way for frontline community members to share their experiences and expertise, discuss issues and collaborate on solutions, and make their voices heard through policy recommendations. And community assemblies are gaining traction throughout the state. The Washington State Department of Social and Health Services is also funding a series of Community Assembly pilots.
Longtime organizer Rosalinda Guillen had advocated for the model locally, after working with numerous farmworker organizations and advocates from Washington State to South America. She was a community organizer with the Rainbow/PUSH Coalition, helping organize the first farmworker union in the state’s history. “Every state agency needs to replace their community engagement plan with the community assembly model,” Guillen said on a 2023 panel.
Another goal of Community Assemblies is to support Black, Brown, Indigenous, and low-income communities to participate more fully in the process of policymaking. “We’re working with frontline communities to be able to build and sustain a civic muscle where they are active participants in the conversation of better policies, better investments, and more targeted programming,” said Fido.

Urban League of Metropolitan Seattle
For Camille Gipaya, the process has already had immediate, visible effects. Gipaya is a community outreach organizer at the Urban League of Metropolitan Seattle. While the issues their assembly addressed were broad — food and water, land use, pollution, and redlining — she says that bringing people together has very literally changed how they show up. “We [went] to Olympia [to] talk to legislators, and we had individuals that we met at the Community Assembly that were there who were not interested in talking to politicians beforehand, but [then] they felt empowered to be more engaged,” she said.
Using this model is important to Gipaya, because it prioritizes the communal lived experiences of people who will be most affected by climate change. Instead of trying other methods to determine the best way forward, this initiative simply asks people to determine the best path themselves. “When looking at policy, it has to be more than just data and numbers,” she said. “Oftentimes, having seen [how policy has worked] in the past, we really have to connect with community members. We cannot afford to be disconnected with frontline communities.”
This story was produced in partnership with Communities of Opportunity, a growing partnership that believes every community can be a healthy, thriving community. Communities of Opportunity is a unique community-private foundation-government partnership that invests in the power of communities in King County, Washington.
This story was originally published by Grist with the headline Looking to create effective climate change policy? Ask the community. on Apr 15, 2025.
]]>
6629417
https://grist.org/accountability/public-lands-private-profits-inside-the-trump-plan-to-offload-federal-land/
Tue, 15 Apr 2025 08:45:00 +0000
https://grist.org/?p=662682
<![CDATA[
The Trump administration is poised to begin offloading public land, achieving a long-held conservative goal of reducing the government’s footprint in the West. Federal agencies manage around 640 million acres, or about 28 percent of the nation’s land, an invaluable resource Interior Secretary Doug Burgum has called “America’s balance sheet.” His membership in a luxury real estate club in Montana provides an apt example of how private interests stand to profit from federal lands.
Last month, the Interior Department and the Department of Housing and Urban Development announced a plan to make large tracts of government land available to developers. “As we enter the Golden Age promised by President Trump,” Burgum wrote on March 17, “this partnership will change how we use public resources.”
Little has been shared so far about the process for identifying parcels or how they might be sold or transferred. Burgum told CNBC the Interior Department would consider selling hundreds of thousands of federally managed acres within 3 miles of urban areas. Jon Raby, the acting director of the Bureau of Land Management, told Bloomberg News the initiative would consider land within 10 miles of towns of 5,000 people. “Either they are making this up as they go along, or the right hand doesn’t know what the left hand is doing,” said Aaron Weiss, deputy director of the Center for Western Priorities, a nonpartisan conservation group.
The task force said it will deliver a report to the National Economic Council by today, identifying parcels and outlining how much housing would be built. It also will offer recommendations to “reduce the red tape behind land transfers or leases” by “[s]treamlining the regulatory process.” The Interior Department declined an interview but said in a statement to Grist that “all options are being explored.”
Burgum’s connection to the Yellowstone Club demonstrates the potential conflicts of interest that can arise with federal land transfers. According to documents filed with the U.S. Office of Government Ethics, which declined to comment, Burgum has not divested his financial interest in the Yellowstone Club. The luxury real estate investment firm owns an exclusive community that covers about 14,000 acres and includes a members-only ski resort. Burgum owns two homes and additional financial interests in the development, which is about an hour south of Bozeman, Montana.
Over the last 30 years, the Yellowstone Club has used public land transfers and sales to amass holdings that include a private mountain, trophy trout waters, and an exclusive resort that caters to the wealthy and powerful. Its most recent deal saw the company, which declared bankruptcy in 2009 and was acquired by private equity firm CrossHarbor Capital for a fraction of its value, embark on a controversial land swap in southwestern Montana.
That deal was finalized January 17, during the last days of the Biden administration and two months after President Trump nominated Burgum to lead the Interior Department. Private landowners received 3,855 acres from the U.S. Forest Service in the readily accessible foothills of the Crazy and Madison mountains, including 420 acres for the Yellowstone Club. In exchange, the Forest Service, which is part of the Department of Agriculture, received 6,110 acres of land with fewer recreational opportunities and less valuable wildlife habitat. The value of the exchange, which critics argued dramatically reduced access to the mountains by eliminating access to established trails, was never disclosed.
“The version they approved was purposely meant to make it harder for the public to access what remains,” said Nick Gevock, a campaign organizer for the Sierra Club. “By strategically trading lands you can restrict access to thousands of acres of public land, and effectively make them private.”
William Campbell / Corbis via Getty Images
A representative of the Yellowstone Club said in a statement that Burgum “has nothing to do with Yellowstone Club development nor does he have anything to do with the land exchange.” The statement also said that “the Yellowstone Club is one of numerous private landowners involved in the exchange in two mountain ranges,” and noted the Club saw a net reduction in its land holdings with the deal. It also said the swap included conservation easements to protect land on Crazy Peak and in the Madison Range, and that the Forest Service received several tracts it had long sought. The Forest Service declined to comment.
Opponents, including conservative hunting and angling groups, claimed the process violated environmental regulations and misled the public about the Yellowstone Club’s involvement as a neutral party when it paid the bulk of the transaction costs. Gevock, who started following the Club’s business dealings 24 years ago as a reporter for the Bozeman Chronicle, said more than 80 percent of public comments submitted to the Forest Service opposed the deal. That land, which was popular with skiers, hunters, anglers, and hikers, is now beyond the public’s grasp.
“Once the title is transferred, you never get it back,” he said.
The Yellowstone Club — which, through its subsidiary development manager Lone Mountain Land Company, is the de-facto governing structure for the town of Big Sky, Montana — sits close to a great deal of prime federal real estate, including parcels managed by the National Park Service, the Bureau of Land Management, and the Forest Service. Critics fear that land may now become available to industry and developers.
Richard Painter, who served as the chief ethics lawyer to President George W. Bush from 2005 to 2007, told Grist there are several ways that any acquisition of federal land by the Yellowstone Club could affect Burgum’s financial interests, including changing the value of his properties or potentially lowering fees that the club’s homeowners pay. If the joint task force sets legal precedent to streamline or reduce regulations around federal land swaps, that could impact the Yellowstone Club’s future dealings. If Burgum helps facilitate or speed up future land swaps between the Department of Interior and the club, it would be a direct ethics violation. As a result, “I would strongly urge that he recuse himself from any land swap regulations,” Painter said.
Painter told Grist the Interior Department has been a “problem child in ethics” for years, and he testified to Congress about it last April. He warned about the longstanding close ties between senior Interior Department officials and private industry, and the growing influence of corporations. Congress and the Interior, he said, have a “fiduciary obligation to oversee the administration of federal land for the American people, not just for whoever wants to go and get preferential access to land.”
Burgum has used the Yellowstone Club in his political role, hosting a fundraiser with Trump last August there that donors paid $100,000 to attend. He also is not the only politician with ties to the club. Energy Secretary Chris Wright is a member, as are Montana Governor Greg Gianforte, U.S. Representative Troy Downing, and U.S. Senator Tim Sheehy. “This is the billionaire class wanting to run the country,” Gevock said, “and their vision for the Rocky Mountain West is privatization.”
In its March announcement, the Interior Department positioned its joint task force on selling public land as a chance “to build affordable housing stock.” But experts question whether anything that comes of this plan would be accessible to low-income families or actually lower housing prices.
Supply constraints are not the primary factor for the country’s housing crisis. Housing stock has risen steadily since 1980, according to a 2023 Congressional Research Service report, although not always where it’s most needed or at the right prices. “On a national level, it is not necessarily obvious that there is a shortage of housing units,” the report found.
“We actually have more of a supply mismatch than a supply problem,” said Karen Chapple, director of the School of Cities at the University of Toronto. A generation of empty nesters is deciding to stay put rather than move into smaller homes, reducing the national supply of single-family homes in urban areas, she said, even as rural communities see vacancies created by people moving in search of opportunities. And high mortgage rates have recently led people to stay put, reducing the overall supply of homes for sale.
Much of the acreage the government manages is in the West and Alaska, often far from jobs and essential infrastructure like roads, water, sewer, and schools. “Everyone who can’t afford housing in Massachusetts is not just going to move to the middle of nowhere in Idaho,” said Brett Hartl, government affairs director for the Center for Biological Diversity.
Instead, the proposal reflects a history of Republican attempts to dismantle public lands that dates to the Sagebrush Rebellion of the 1970s, when conservatives opposed to federal regulations argued states could better manage Western land. (President Ronald Reagan named one of the movement’s allies, James Watt, as Secretary of the Interior in 1981.) The idea still enjoys support among developers, ranchers, and others interested in profiting from the land.
The general public largely opposes the idea. A recent Colorado College poll of Western voters found 82 percent disapproved of selling federal land to address the region’s housing problems. “The land seizure movement is wildly unpopular across party lines,” Weiss said. “You’re getting to the point where the polling is as obvious as asking if people like apple pie.”
On top of widespread opposition, basic math has gotten in the way. The federal government often operates public lands at a loss: The Bureau of Land Management, for instance, regularly spends 10 times as much managing grazing lands as it collects in fees. If states took over, they would bear the cost of essential services like wildfire management. That is noteworthy, Weiss said, because the areas under consideration lie in “the wildland-urban interface, the most dangerous place to build.”
That hasn’t kept the idea from resurfacing. During Trump’s first term, Interior Secretary Ryan Zinke held a closed-door meeting to discuss transfers with the American Legislative Exchange Council, a conservative think tank that favors giving states control of federal land. Zinke opposed the notion, but still oversaw the largest giveaway of the modern era. (One of the scandals that eventually led to his resignation involved a real estate deal with the chairman of oil services company Halliburton while it benefited from unprecedented federal leases.)
Utah Republican Senator Mike Lee has emerged as a leading advocate for reducing federal land ownership. In 2022 and again in 2023, he introduced legislation authorizing the sale of government land to developers. He also supported a lawsuit seeking state control of 18.5 million acres held by the Bureau of Land Management; the Supreme Court declined to hear the case in January.

Meanwhile, Project 2025, the conservative blueprint for Trump’s second term, laid the groundwork for the latest push. The chapter on the Interior Department was written by William Pendley, who led the Bureau of Land Management during Trump’s first term and once argued that the “Founding Fathers intended all lands owned by the federal government to be sold.” It calls the government “a bad manager of the public trust” and proposes sweeping changes, including weakening environmental protections and increasing drilling, mining, and logging on public land.
Kathleen Sgamma, who was Trump’s pick to lead the bureau until she withdrew from consideration last week, also contributed to the chapter. The oil and gas lobbyist previously signaled her support to offload the country’s land. When a dispute over federal grazing fees prompted a standoff between ranchers and the bureau in Oregon, she said the incident “arises from too much federal ownership of land in the West.”
In the meantime, Katharine MacGregor, vice president of fossil fuel-focused NextEra Energy, was confirmed as a deputy interior secretary in April. During her nomination hearing, MacGregor promised support for over a decade of oil and gas leases. (Watchdog group Fieldnotes found she had systematically concealed public records during her previous time at the Interior, concealing information about her extensive interactions with oil and gas executives.) Burgum also told oil and gas executives in March that selling public land could eliminate the $35 trillion (and growing) national debt.
Even as Burgum positions such deals as a solution to the nation’s woes, critics warn that the lack of safeguards could lead to unintended consequences. There is nothing to suggest the joint task force or the Trump administration will take steps to “prevent those [housing developments] from just turning into vacation homes for billionaires,” Weiss said. And many of the federal employees who would oversee the venture have recently been fired. The Trump administration intends to cut Housing and Urban Development by 84 percent, and has frozen $60 million in funding for other affordable housing developments, stalling hundreds of projects.
“At every level, it’s a scam and a con,” Hartl said, “and the only people that will benefit from it are the people that already benefit from the housing crisis.”
Correction: This story originally misstated how many acres the Yellowstone Club received in the land swap with the U.S. Forest Service.
This story was originally published by Grist with the headline Public lands, private profits: Inside the Trump plan to offload federal land on Apr 15, 2025.
]]>
66268211
https://grist.org/extreme-weather/why-the-forest-service-is-logging-after-hurricane-helene-and-why-some-say-its-a-mistake/
Tue, 15 Apr 2025 08:30:00 +0000
https://grist.org/?p=662887
<
Ted Richardson / The Washington Post via Getty Images
Timber salvage is a complex process that requires surveying immense tracts of land, much of it remote and occasionally treacherous, to determine the damage, its impact, and how best to clear it. A scientific assessment, which typically takes about six months, determines the environmental impact of the operation. After that, the environmental impact statement is subject to public comment, after which it is revised into a final version. Once all of that is done, bids are solicited. The cost varies with the scale of the project, any roads that must be built or improved, and other factors, but the baseline is 25 cents per cubic foot of lumber. Then, salvage begins.
Such work is difficult and dangerous. “It’s brutal,” said Bryan Box, a timber cruiser involved in a Helene-related operation in Georgia. His job includes choosing trees for removal and estimating how many trees are hauled off for sale. Clearing them requires working with immense machinery in rugged, often steep, terrain. Accidents can be deadly, and crews toil far from help should anything go wrong.
Salvaging is ecologically disruptive. It can cause erosion, introduce fire-prone invasive plants, alter natural habitat, and impact water quality. That is why it is, like other logging projects, regulated under the National Environmental Policy Act, or NEPA. A forester’s job, Box said, is to use those guidelines to mitigate risks while protecting any endangered species, archaeological sites, or rare habitat. Box has been involved in NEPA reviews around the country, and understands the scientific questions and ecological intricacies involved with salvage.
“The wildlife biologist comes in and says, ‘OK, here’s where our known hawk nests were prior to the storm,” he offered as an example. Or botanists might look for threatened plants like American ginseng. “They have to have language in the environmental impact statement going over that sort of biological analysis.” All of that information is presented in an environmental impact statement and published so the public can review it.
Salvage logging isn’t necessarily profitable, and companies often see it as a chance to squeeze a few dollars out of wood that otherwise might be left to rot. A forest disturbance like a hurricane can devastate local timber markets by making wood suddenly abundant, driving down its value. It doesn’t help that downed trees are less valuable than freshly-cut trees. Box said timber companies sometimes take healthy trees along with the salvage to make more money.
“As long as it’s a targeted salvage project whose aim is simply to remove dead and downed wood, that’s a worthy goal,” said Will Harlan, of the Center for Biological Diversity, who signed a letter asking the Forest Service to allow the public to comment on the projects. “What we get worried about is when the project expands beyond salvage logging to include intact, healthy, mature forests that are nearby, being lumped into the project just to make money.”
The Forest Service does have ways to prevent this. It requires a timber sale administrator to visit logging sites every 14 days to make sure everything is on the up and up. Ideally, these agency employees are “watching like hawks,” Box said. But in reality, there are often so many projects going on at once that an administrator might have over a dozen projects to oversee. And the agency, already stretched thin, may soon see further staffing cuts.
It doesn’t help that there is currently little regulatory pressure from above to enforce the National Environmental Policy Act. Recently released federal directives for the Forest Service invoke the need for logging as a means for preventing fires and promoting biodiversity, and point towards streamlining NEPA and eradicating it where possible.
Some forest ecologists believe salvage is a flawed fire prevention strategy because removing so much timber can actually increase fire risk. Trees, even fallen ones, keep the ground moist and cool; without them, it dries out. “Big logs are creating shade and humidity and don’t dry out that well,” said Josh Kelly, a forest ecologist with conservation nonprofit MountainTrue. “They can actually slow a fire down.” He isn’t opposed to clearing down trees, “so long as salvage really is aimed at reducing wildfire risk and logging debris is dealt with after logging and either chipped or mulched or pulled away from roads. I just really wish there wasn’t this secrecy surrounding it.”
Critics also argue that salvage logging does more harm than good and a damaged forest ought to be left to recover on its own, especially given the trauma it has already endured. “If you look at Webster’s dictionary, salvage is taking something of value from something that’s been destroyed,” said conservation biologist Dominick DelaSalla, an ardent opponent of the practice.
Blowdowns are part of the natural cycles that create the diverse habitats needed to ensure forest health and diversity, he said. Those downed logs have greater value in nurturing life by cycling nutrients and creating habitat, two benefits that outweigh any financial gain gleaned from their harvest. Removing them, he said, can interrupt or alter the process of regrowth, especially when many forest types, like some in Appalachia, are fire-adapted. Rather than clearing downed trees and old growth, DelaSalla said fire mitigation should focus on creating fuel breaks, promoting fire safety education, fireproofing homes, and adopting zoning regulations that minimize further expansion into the wildland-urban interface.
Kelly said while smaller twigs downed by Helene may be linked to the fires that burned last month, and the downed trees littering Pisgah and other forests may not pose a threat until they’ve had a few years to dry out. Other factors post a far greater threat, he said. “The Southeast in general has been having a very active fire season due to global warming and weather,” he said. Last month was the lowest-humidity March on record for much of the region.
Ultimately, conservationists would prefer a stewardship-based approach to letting damaged forests regenerate at their own pace. That approach can conflict with the pressure to maintain public safety, the federal government’s interest in increasing logging, and the economic benefits recreation and tourism bring to communities. Such tensions will only increase as climate change brings more frequent, and more intense storms like Helene and the nation’s forests grow increasingly vulnerable.
“What we’re going to continue to see is probably increased rates of canopy turnover, increased mortality rates of the older trees, and a changing species composition and conditions,” said Kelly. “There won’t be an equilibrium until the climate and weather reach an equilibrium.”
Lilly Knoepp contributed reporting to this story.
This story was originally published by Grist with the headline Why the Forest Service is logging after Hurricane Helene — and why some say it’s a mistake on Apr 15, 2025.
]]>
6628879
https://grist.org/climate/new-technologies-are-helping-to-regrow-arctic-sea-ice/
Mon, 14 Apr 2025 08:45:00 +0000
https://grist.org/?p=662757
<
The researchers are from Real Ice, a United Kingdom-based nonprofit on a mission to preserve this dwindling landscape. Their initial work has shown that pumping just 10 inches of ocean water on top of the ice also boosts growth from the bottom, thickening it by another 20 inches. This is because the flooding process removes the insulating snow layer, enabling more water to freeze. When the process is done, the patch of ice measured up to 80 inches thick — equal to the lower range of older, multi-year ice in the Arctic. “If that is proved to be true on a larger scale, we will show that with relatively little energy we can actually make a big gain through the winter,” said Andrea Ceccolini, co-CEO of Real Ice. Ceccolini and Cian Sherwin, his partner CEO, ultimately hope to develop an underwater drone that could swim between locations, detecting the thickness of the ice, pumping up water as necessary, then refueling and moving on to the next spot.
This winter, they carried out their largest field test yet: comparing the impact of eight pumps across nearly half a square mile off the coast of Cambridge Bay, a small town in the Kitikmeot Region of Nunavut, part of the Canadian Arctic. They now wait until June for the results.
Their work is at the heart of a debate about how we mitigate the damage caused by global warming, and whether climate interventions such as this will cause more harm than good.
Loss of sea ice has consequences far beyond the Arctic. Today, the vast white expanse of this ice reflects 80 percent of the sun’s energy back into space. Without it, the dark open ocean will absorb this heat, further warming the planet. According to the Scripps Institution of Oceanography at the University of California, San Diego, if our sea ice disappears entirely, it will add the equivalent warming of 25 years of carbon dioxide emissions. There are also huge implications for our weather patterns: Diminishing sea ice is already changing ocean currents, increasing storms, and sending warmer, drier air to California, causing increased wildfires. Within the Arctic, loss of ice means loss of habitat and food security for the animals, microorganisms, and Indigenous communities that depend on it.
“Personally, I’m terrified,” said Talia Maksagak, executive director of the Kitikmeot Chamber of Commerce, about the changing sea ice. It’s freezing later and thinner each year, affecting her community’s ability to travel between islands. “People go missing, people are traveling and they fall through the ice,” she continues. They also rely on the ice for hunting, fishing, and harvests of wild caribou or musk ox, who migrate across the frozen ocean twice a year — although they, too, are increasingly falling through the thin ice and drowning.
Maksagak has been instrumental in helping Real Ice to consult with the local community about their research, and she is supportive of their work. “If Real Ice comes up with this genius plan to continue the ice freeze longer, I think that would be very beneficial for future generations.”

There are still many questions around the feasibility of Real Ice’s plan, both for critics and the Real Ice researchers themselves. First, they need to establish if the principle works scientifically — that the ice they’ve thickened does last longer, counteracting the speed of global warming’s impact on the region. At worst, adding salty seawater could potentially cause the ice to melt more quickly in the summer. But results from last year’s research suggest not: When testing its pilot ice three months later, Real Ice found its salinity was within normal bounds.
If all goes well with this year’s tests, the next step will be an independent environmental risk assessment. Noise is one concern. According to WWF, industrial underwater noise significantly alters the behavior of marine mammals, especially whales. Similarly, blue cod lay their eggs under the ice, algae grows on it, and larger mammals and birds migrate across it. How will they be impacted by Real Ice’s water pumps? “These are all questions that we need to ask,” said Shaun Fitzgerald, director of the Center for Climate Repair at Cambridge University, which has partnered with Real Ice, “and they all need to be addressed before we can start evaluating whether or not we think this is a good idea.”
Fitzgerald predicts four more years of research are needed before the nonprofit can properly recommend the technology. For now, the Nunavut Impact Review Board, Nunavut’s environmental assessment agency, has deemed Real Ice’s research sites to cause no significant impact.

But critics of the idea argue the process won’t scale. “The numbers just don’t stack up,” said Martin Siegert, a British glaciologist and former co-chair of the Grantham Institute for Climate Change. He pointed to the size of the Arctic — 3.9 million square miles of sea ice on average — and how many pumps would likely be needed to freeze even 10 percent of that. More importantly, who is going to pay for it?
Ceccolini is undaunted by the first question. Their technology is not complicated — “It’s technology from 50 years ago, we just need to assemble it in a new way” — and would cost an estimated $5,000 per autonomous pump. Their models predict that 500,000 pumps could rethicken about 386,000 square miles of sea ice each year, or an area half the size of Alaska. Assuming the thicker ice lasts several years, and by targeting different areas annually, Ceccolini estimates the technology could maintain the current summer sea ice levels of around 1.63 million square miles. “We’ve done much bigger things in humanity, much more complex than this,” he said.
As for who pays, that’s less clear. One idea is a global fund similar to what’s been proposed for tropical rainforests, where if a resource is globally beneficial, like the Amazon or the Arctic, then an international community contributes to its protection. Another idea is “cooling credits,” where organizations can pay for a certain amount of ice to be frozen as an offset against global warming. These are a controversial idea started by the California-based, geoengineering start-up Make Sunsets, which believes that stratospheric aerosol injections — releasing reflective particles high into the Earth’s atmosphere — is another way to cool the planet. However its research comes with many risks and unknowns that has the scientific community worried, and has even been banned in Mexico. Meanwhile faith in the credits system has been undermined in recent years, with several investigations revealing a lack of integrity in the carbon credits industry.

Panganga Pungowiyi, climate geoengineering organizer for the Indigenous Environmental Network, a nonprofit for environmental and economic justice issues, is vehemently against cooling and carbon credits in principle, explaining that they are “totally against our [Indigenous] value system.” She explained that, “it’s essentially helping the fossil fuel industry escape accountability and cause harm in other Indigenous communities — more pain, more lung disease, more cancer.”
This gets to the heart of the debate — not whether a solution like this can be done, but whether it should be done. Inuit opinion is divided. Whilst Maksagak is supportive of Real Ice, Pungowiyi says the technology doesn’t align with Indigenous values, and is concerned about the potential harms of scaling it. In addition to the environmental concerns, Pungowiyi notes that new infrastructure in the Arctic has historically also brought outsiders, often men, and an increase of physical and sexual assault on Indigenous women, many who end up missing or murdered. Ceccolini and Sherwin are aware of such risks and they are clear that any scaling of their technology would be done in partnership with the local community. They hope the project will eventually be Indigenous-run.

“We don’t want to repeat the kind of mistakes that have been made by Western researchers and organizations in the past,” said Sherwin.
Real Ice is not the only company that wants to protect the Arctic. Arctic Reflections, a Dutch company, is conducting similar ice thickening research in Svalbard; the Arctic Ice Project is assessing if glass beads spread over the ice can increase its reflectivity and protect it from melting; and engineer Hugh Hunt’s Marine Cloud Brightening initiative aims to increase the reflectivity of clouds through sprayed particles of sea salt as a way to protect the ice.
“I think these ideas are getting far too much prominence in relation to their credibility and maturity,” said Seigert, referring to conversations about Arctic preservation at annual United Nations climate change meetings, known as COP, and the World Economic Forum. It is not only that these technologies are currently unproven, Seigert noted, but that people are already making policy decisions based on their success. It’s an argument known as “moral hazard” — the idea that developing climate engineering technologies will reduce people’s desire to cut emissions. “This is like a gift to the fossil fuel companies,” he said, allowing them to continue using oil, gas, and coal without change. “We have the way forward, decarbonization, and we need every effort to make that happen. Any distraction away from that is a problem.”

“It’s a strong argument,” agreed Fitzgerald, of Cambridge University, when asked about moral hazard. “I am concerned about it. It’s the one thing that probably does cause me to have sleepless nights. However, we need to look at the lesser of two evils, the risk of not doing this research.”
Or, as Sherwin said: “What is the cost of inaction?”
Those in support of climate intervention strategies stress that, although decarbonization is vital, it’s moving too slowly, and there is a lack of political will. Technologies like those being developed by Real Ice could buy ourselves more time. Paul Beckwith, a climate system analyst from the University of Ottawa, espouts a three-pronged approach: eliminating fossil fuels, removing carbon dioxide from the atmosphere, and protecting the Arctic.
“It should be less a conversation of one over the other and more how we run all three pillars at the same time,” said Sherwin. “Unfortunately we’re in a position now where if we don’t protect and restore ecosystems, we will face collapse.”
toolTips(‘.classtoolTips4′,’The process of reducing the emission of carbon dioxide and other greenhouse gases that drive climate change, most often by deprioritizing the use of fossil fuels like oil and gas in favor of renewable sources of energy.’);
This story was originally published by Grist with the headline Global warming is melting Arctic sea ice. Can science refreeze it? on Apr 14, 2025.
]]>
66275711
Real Ice, a United Kingdom-based nonprofit, is on a mission to preserve this dwindling landscape. Their initial work has shown that pumping just 10 inches of ocean water on top of Arctic sea ice also boosts growth from the bottom, thickening it by another 20 inches. The company ultimately hopes to develop an underwater drone that could swim between locations, detecting the thickness of the ice, pumping up water as necessary, then refueling and moving on to the next spot. However, there are still many questions around the feasibility of the plan, both for critics and the Real Ice researchers themselves.
Real Ice’s work is at the heart of a debate about how we mitigate the damage caused by global warming, and whether climate interventions such as this will cause more harm than good. Supporters of climate intervention strategies stress that although decarbonization is vital it’s moving too slowly, and there is a lack of political will. Loss of sea ice has consequences far beyond the Arctic, and some experts feel that technologies like those being developed by Real Ice could buy ourselves more time.]]>
https://grist.org/equity/national-weather-service-translation-alerts-weather-disasters/
Mon, 14 Apr 2025 08:30:00 +0000
https://grist.org/?p=662772
<![CDATA[
When an outbreak of deadly tornadoes tore through the small town of Mayfield, Kentucky, in December 2021, one family was slow to act, not because they didn’t know what to do. They didn’t know that they should do anything.
The family of Guatemalan immigrants only spoke Spanish, so they didn’t understand the tornado alert that appeared on their cell phones in English. “I was not looking at [an information source] that told me it was going to get ugly,” Rosa, identified only by her first name, told researchers for a study on how immigrant communities responded to the warnings.
Another alert popped up in Spanish, and Rosa and her family rushed downstairs to shelter. Ten minutes later, a tornado destroyed the second floor where they’d been.
For at least 30 years, the National Weather Service, or NWS, had been providing time- and labor-intensive manual translations into Spanish. Researchers have found that even delayed translations have contributed to missed evacuations, injuries, and preventable deaths. These kinds of tragedies prompted efforts to improve the speed and scope of translating weather alerts at local, state, and national levels.
Early into the Biden administration, the agency began a series of experimental pilot projects to improve language translations of extreme weather alerts across the country. The AI translating company Lilt was behind one of them. By the end of 2023, the agency had rolled out a product using Lilt’s artificial intelligence software to automate translations of weather forecasts and warnings in Spanish and Chinese.
“By providing weather forecasts and warnings in multiple languages, NWS will improve community and individual readiness and resilience as climate change drives more extreme weather events,” Ken Graham, director of the NWS at the National Oceanic and Atmospheric Administration said in a press release announcing the 2023 launch. Since then, the service also added automatic translations into Vietnamese, French, and Samoan. The machine-learning system could translate alerts in just two to three minutes — what might take a human translator an hour — said Joseph Trujillo Falcón, a researcher at the University of Illinois Urbana-Champaign whose work supported the program.
And now those alerts are gone. The NWS has indefinitely suspended its automated language translations because its contract with Lilt has lapsed, according to an April 1 administrative message issued by the agency. The sudden change has left experts concerned for the nearly 71 million people in the U.S. who speak a language other than English at home. As climate change supercharges calamities like hurricanes, heat waves, and floods, the stakes have never been higher — or deadlier.
“Because these translations are no longer available, communities who do not understand English are significantly less safe and less aware of the hazardous weather that might be happening in their area,” said a National Oceanic and Atmospheric Administration employee familiar with the translation project, whom Grist granted anonymity to protect them from retaliation. Hundreds of thousands of alerts were translated by the Lilt AI language model, the employee said.
An internal memo reviewed by Grist showed that the National Weather Service has stopped radio translations for offices in its southern region, where 77 million people live, and does not plan to revert to a previous method of translation — meaning that its broadcasts will no longer contain Spanish translations of forecasts and warnings. The move enraged some workers at local NWS offices, according to conversations relayed to the employee, as the decision not to restart radio translations was due to the workload burden as the service’s workforce faces cuts under the Trump administration.
No clear reason was given as to why the contract lapsed and the agency has discontinued its translations, the employee said. “Due to a contract lapse, NWS paused the automated language translation services for our products until further notice,” National Oceanic and Atmospheric Administration weather service spokesperson Michael Musher told Grist in a statement. Musher did not address whether the NWS plans to resume translations, nor did he address Grist’s additional requests for clarification. Lilt did not respond to a request for comment.
Fernando Rivera, a disaster sociologist at the University of Central Florida who has studied language-equity issues in emergency response, told Grist the move by the administration “is not surprising” as it’s in “the same trajectory in terms of [Trump] making English the official language.” Rivera also pointed to how, within hours of the president’s inauguration, the Trump administration shut down the Spanish-language version of the White House website. Trump’s mandate rescinded a decades-old order enacted by former President Bill Clinton that federal agencies and recipients of federal money must provide language aid to non-English speakers.
“At the end of the day, there’s things that shouldn’t be politicized,” Rivera said.
Of the millions of people living in the U.S. who don’t speak English at home, the vast majority speak Spanish, followed by Chinese, Tagalog, Vietnamese, and Arabic. Now that the contract with Lilt has lapsed, it’ll be difficult to fulfill the Federal Communications Commission’s pre-Trump ruling on January 8 that wireless providers support emergency alerts in the 13 most common languages spoken in the U.S., said Trujillo Falcón, the researcher at the University of Illinois Urbana-Champaign.
The gap will have to be filled by doing translations by hand, or by using less accurate automated translations that can lead to confusion. Google Translate, for example, has been known to use “tornado clock” for “tornado watch” and grab the word for “hairbrush” for “brush fires” when translating English warnings to Spanish. Lilt, by contrast, trained its model specifically on weather-related terminologies to improve its accuracy.
While urban areas might have news outlets like Telemundo or Univision that could help reach Spanish-speaking audiences, rural areas don’t typically have these resources, Trujillo Falcón said: “That’s often where a lot of multilingual communities go to work in factories and on farms. They won’t have access to this life-saving information whatsoever. And so that’s what truly worries me.”
It’s an issue even in states with a large population of Spanish speakers, like California. “It’s assumed that automatic translations of emergency information is commonplace and ubiquitous throughout California, but that’s not the case, particularly in our rural, agricultural areas where we have farmworkers and a large migrant population,” said Michael Méndez, a professor of environmental policy and planning at the University of California, Irvine.
Méndez said that Spanish speakers have been targeted by misinformation during extreme weather. A study in November found that Latinos who use Spanish-language social media for news were more susceptible to false political narratives pertaining to natural disaster relief and other issues than those who use English-language media. The National Weather Service alerts were “an important tool for people to get the correct information, particularly now, from a trusted source that’s vetted,” Méndez said.
Amy Liebman, chief program officer at the nonprofit Migrant Clinicians Network, sees it only placing a “deeper burden” on local communities and states to fill in the gaps. In the days since the weather service contract news first broke, a smattering of local organizations across the country have already announced they will be doubling down on their work offering non-English emergency information.
But local and state disaster systems also tend to be riddled with issues concerning language access services. A Natural Hazards Center report released last year found that in hurricane hotspots like Florida, state- and county-level emergency management resources for those with limited English proficiency are scarce and inconsistent. All told, the lack of national multilingual emergency weather alerts “will have pretty deep ripple effects,” said Liebman. “It’s a life or death impact.”
This story was originally published by Grist with the headline Millions of Americans don’t speak English. Now they won’t be warned before weather disasters. on Apr 14, 2025.
]]>
6627727
Early into the Biden administration, the agency began a series of experimental pilot projects to improve language translations of extreme weather alerts across the country. The AI translating company Lilt was behind one of them. The machine learning system could translate alerts in just two to three minutes. By the end of 2023, the NWS had rolled out a product using Lilt’s artificial intelligence software to automate translations of weather forecasts and warnings in Spanish and Chinese. The service also added automatic translations into Vietnamese, French, and Samoan.
But according to an April 1 administrative message on the agency’s website, the National Weather Service has indefinitely suspended its contract with Lilt. The sudden change has left experts concerned for the nearly 71 million people in the U.S. who speak a language other than English at home.]]>
https://grist.org/wildfires/trump-said-cuts-wouldnt-affect-public-safety-then-he-fired-hundreds-of-workers-who-help-fight-wildfires/
Sun, 13 Apr 2025 13:00:00 +0000
https://grist.org/?p=662620
<
“It’s all really muddled in chaos, which is sort of the point,” one Forest Service employee told ProPublica.
“This agency is no longer serving its mission,” another added.
The employees asked not to be named for fear of retribution.
The Forest Service did not respond to questions about the impact of cuts other than to clarify the number of terminated employees. The Forest Service spokesperson said about 2,000 probationary employees — typically new staff and those who were recently promoted, groups that have fewer workplace protections — were fired in February. Others with knowledge of the terminations, including a representative of a federal union and a Senate staffer, said the original number of terminated employees was 3,400 but that decreased, likely as workers were brought back in divisions such as timber sales.
The White House and a representative from the Department of Government Efficiency did not respond to requests for comment.
In early March, an independent federal board that reviews employees’ complaints compelled the Department of Agriculture, the Forest Service’s parent department, to reinstate more than 5,700 terminated probationary employees for 45 days. During their first weeks back on the payroll, many, including Forest Service personnel, were put on paid administrative leave and given no work.
The administration and DOGE continue working toward layoffs amid court challenges to their moves. Word circulated throughout the Forest Service in March that departmental leadership had compiled lists containing the names of thousands of additional Forest Service employees who could be soon laid off, according to some workers.
Additionally, understaffing in the agency’s information technology unit is threatening firefighting operations, according to an agency employee. In December, the branch chief overseeing IT for the agency’s fire and aviation division left the job. The Department of Agriculture posted the job opening, describing the division as providing “support to the interagency wildland fire community’s technical needs.” This includes overseeing software that firefighting crews use to request equipment — everything from fire-resistant clothing to hoses — from the agency’s warehouses so first responders have uninterrupted access to lifesaving equipment.
The day after Trump’s inauguration, the Department of Agriculture removed the IT job posting. The position remains unfilled, according to an employee with knowledge of the situation.
The hiring of new firefighters has also bogged down amid the deluge of sometimes-conflicting orders from the administration and DOGE, Forest Service staffers said.
“We are really, really behind onboarding our employees right now,” a Forest Service firefighter told ProPublica.
The staffing issues exacerbate challenges that predate the second Trump administration. To address a massive budget shortfall, the Forest Service under President Joe Biden last year paused the hiring of seasonal workers, except those working on wildfires. (Firefighters did see a permanent pay increase codified by Congress in its recently approved spending bill.)
Still, many permanent employees, including many firefighters, work on a seasonal basis and are placed on an unpaid status for several months each year when there is less work. Uncertainty within the federal government has led many of these employees to give up on government work and look elsewhere.
“Some of our people have taken other jobs,” one Forest Service employee told ProPublica. “People aren’t going to wait around.”
Cuts to the agency’s legal department will also curb its ability to care for the nation’s forests and fight wildfires, an employee told ProPublica. Large prescribed burns and other vegetation-removal projects require environmental review, a process that is often targeted with lawsuits, including by green groups concerned that the efforts go too far in removing trees.
A smaller legal staff could lead to fewer prescribed burns, increasing the risk of catastrophic fires, according to a lawyer for the Department of Agriculture who worked on Forest Service projects. The lawyer was fired in the mid-February purge of probationary employees.
“Every time we lose a case out West, it means the Forest Service can’t do a project, at least temporarily,” the lawyer said.
“They’re going to get sued more, and they’re going to lose more,” said the lawyer, who was reinstated in March following the board ruling that the Department of Agriculture’s mass firings were illegal.
The employee received back pay but was immediately put on administrative leave. Because of the cuts to support staff, it was several weeks before many of the returning employees were reissued government laptops and badges and allowed to do any work.
“Government efficiency at its finest,” the lawyer said.
This story was originally published by Grist with the headline Trump said cuts wouldn’t affect public safety. Then he fired hundreds of workers who help fight wildfires. on Apr 13, 2025.
]]>
6626206
–>
- Source: https://grist.org/feed/


