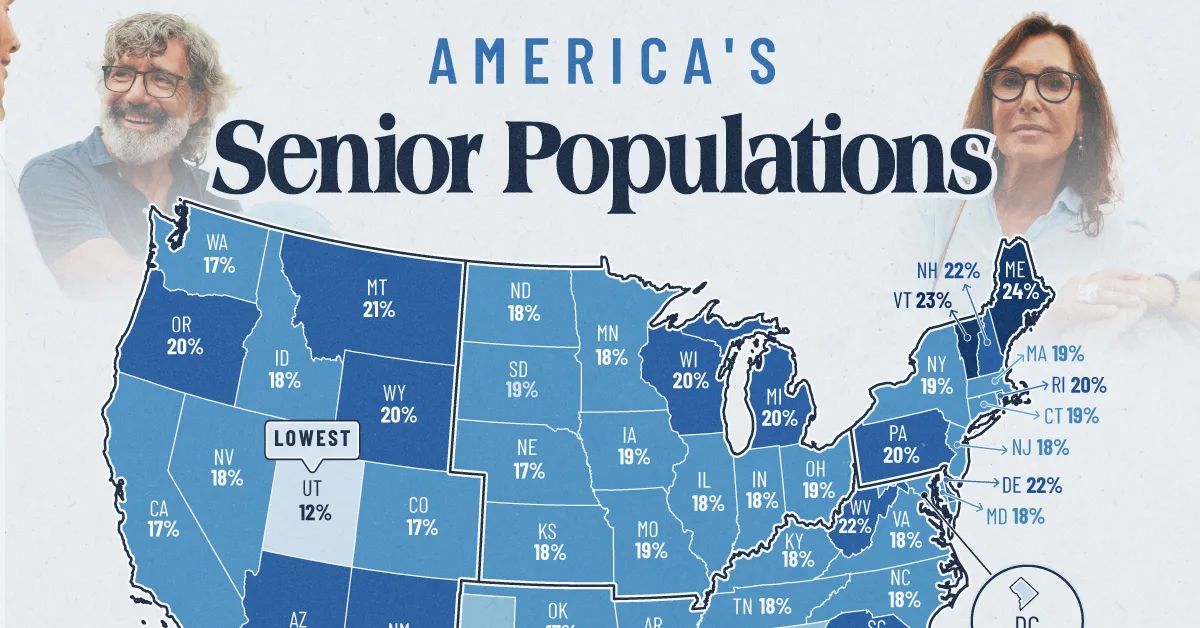
Mapped: The Share of Seniors in Every U.S. State
See visuals like this from many other data creators on our Voronoi app. Download it for free on iOS or Android and discover incredible data-driven charts from a variety of trusted sources.
Key Takeaways
- Maine has the highest share of seniors in the country, with 23.5% of residents aged 65 or older.
- Seniors account for more than one in five residents across much of the Northeast, as well as Florida and several Western states.
- Utah has the lowest share of seniors, at 12.4%, roughly half of Maine’s share.
America’s population is aging, but the trend looks very different from one state to the next.
Using the latest U.S. Census Bureau data via USAFacts, this map shows the share of residents aged 65 and older in every state.
These differences have growing implications for healthcare, housing, public services, and the workforce.
The States With the Highest Share of Seniors
The Northeast is home to many of the states with the highest shares of seniors. Maine (23.5%), Vermont (22.9%), Delaware (21.7%), and New Hampshire (21.5%) all rank near the top. Florida and Hawaii also stand out, with retirees helping to push their senior shares above one in five.
| Rank | State | Share of Population (Aged 65+, 2024) |
Total Senior Population (2024) |
|---|---|---|---|
| 1 | Maine | 23.5% | 330K |
| 2 | Vermont | 22.9% | 148K |
| 3 | West Virginia | 21.9% | 387K |
| 4 | Florida | 21.8% | 5.1M |
| 5 | Delaware | 21.7% | 228K |
| 6 | Hawaii | 21.5% | 311K |
| 7 | New Hampshire | 21.5% | 303K |
| 8 | Montana | 21.2% | 241K |
| 9 | Pennsylvania | 20.4% | 2.7M |
| 10 | New Mexico | 20.1% | 429K |
| 11 | Wyoming | 20.0% | 117K |
| 12 | Oregon | 19.9% | 850K |
| 13 | South Carolina | 19.8% | 1.1M |
| 14 | Rhode Island | 19.8% | 220K |
| 15 | Arizona | 19.7% | 1.5M |
| 16 | Michigan | 19.6% | 2.0M |
| 17 | Wisconsin | 19.6% | 1.2M |
| 18 | Connecticut | 19.4% | 713K |
| 19 | Ohio | 19.1% | 2.3M |
| 20 | South Dakota | 19.0% | 176K |
| 21 | New York | 18.9% | 3.8M |
| 22 | Iowa | 18.9% | 613K |
| 23 | Massachusetts | 18.7% | 1.3M |
| 24 | Missouri | 18.7% | 1.2M |
| 25 | Alabama | 18.5% | 955K |
| 26 | Minnesota | 18.2% | 1.1M |
| 27 | Arkansas | 18.2% | 563K |
| 28 | Mississippi | 18.1% | 531K |
| 29 | New Jersey | 18.0% | 1.7M |
| 30 | Kentucky | 18.0% | 826K |
| 31 | Kansas | 18.0% | 534K |
| 32 | Illinois | 17.9% | 2.3M |
| 33 | North Carolina | 17.9% | 2.0M |
| 34 | Louisiana | 17.8% | 820K |
| 35 | Idaho | 17.8% | 356K |
| 36 | Virginia | 17.6% | 1.6M |
| 37 | Tennessee | 17.6% | 1.3M |
| 38 | Indiana | 17.6% | 1.2M |
| 39 | Maryland | 17.6% | 1.1M |
| 40 | Nevada | 17.6% | 575K |
| 41 | North Dakota | 17.6% | 140K |
| 42 | Nebraska | 17.4% | 348K |
| 43 | Washington | 17.3% | 1.4M |
| 44 | Oklahoma | 16.9% | 692K |
| 45 | California | 16.5% | 6.5M |
| 46 | Colorado | 16.5% | 980K |
| 47 | Georgia | 15.8% | 1.8M |
| 48 | Alaska | 14.8% | 109K |
| 49 | Texas | 14.0% | 4.4M |
| 50 | District of Columbia | 12.9% | 91K |
| 51 | Utah | 12.4% | 435K |
| — |  U.S. Average U.S. Average |
17.7% | 61.2M |
At the other end of the ranking, fast-growing states with younger populations, including Utah and Texas, remain well below the national average. Migration patterns and birth rates continue to shape these demographic differences.
Overall, the senior share in Maine is nearly twice as high as in Utah, illustrating the wide age gap between states.
Why America’s Population Is Aging
Several long-term demographic trends are pushing America’s population older.
The Baby Boomer generation is entering retirement, Americans are living longer, and birth rates have fallen to historic lows. At the same time, retiree migration is increasing the share of older residents in some states, while younger adults are concentrating in fast-growing metro areas.
The demographic balance is nearing a historic turning point. By 2034, older adults are projected to outnumber children nationwide for the first time.
These shifts are already reshaping demand for healthcare, housing, and public services. They also help explain why some states are aging faster than others and why the gaps may continue to widen.
Learn More on the Voronoi App 
To learn more about this topic, check out this graphic on immigration’s role in state population growth.