

The following information is from the 2026 FCC Food and Beverage Report, which highlights the opportunities and challenges for Canadian food manufacturers by sector. To get the big picture, read the full report.
Resilience amid changing trade landscape
The seafood-preparation and -processing sector includes businesses that smoke, salt, dry, freeze or otherwise prepare fish and seafood, as well as those that process marine fats and oils. It also includes floating factory ships that conduct processing at sea. North American seafood processing is highly integrated and concentrated, with most Canadian operations located in the Atlantic provinces and British Columbia. These processors supply a wide range of downstream markets from wholesalers, distributors, foodservice, retailers and global buyers to industries such as pharmaceuticals, animal feed and fertilizer manufacturing.
Seafood-preparation sales: 2026 forecast
Canada’s seafood-processing sector remains overwhelmingly export-driven, with roughly 90 per cent of prepared and packaged seafood destined for global markets. This heavy reliance on exports amplifies exposure to international disruptions, and 2025 offered a clear example. Trade uncertainty early in the year from the sector’s two largest export markets (that is, United States and China) constrained shipments, and although processors benefited from stronger prices, those gains were not enough to offset weaker volumes. Overall sales slipped 2.2 per cent while volumes (that is, sales adjusted for inflation) fell 5.2 per cent (Figure 7.1).
Figure 7.1: Seafood-preparation sales steady in 2026
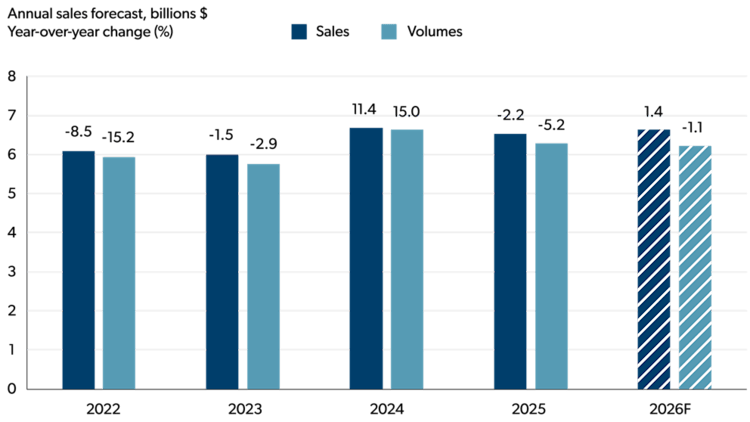
Total sales and volumes (in $, billions) are on the vertical axis and shown by the height of each bar. The number above each bar is the year-over-year growth as a percent. Volumes are sales deflated by a price index (Jan. 2020 = 100).
Sources: FCC Economics, Statistics Canada
Considering these headwinds, the sector demonstrated notable resilience. China’s tariff implementation in March 2025 triggered an immediate drop in exports compared with 2024. But Canadian products did find alternative buyers. By year-end, export volumes were only 0.8 per cent below 2024 levels and the value of exports was up 5.9 per cent. This relatively rapid recovery highlights the sector’s long-standing global reach, exporting to 107 countries in 2024.
Momentum entering 2026 appears favourable at this point. Export activity began trending upward late in 2025, and China’s decision to suspend discriminatory tariffs on crabs, lobsters and other products until the end of 2026 comes just in time for the beginning of the season, further improving conditions. Domestic consumption, meanwhile, is expected to remain subdued. Canadian households continue to face affordability pressures and a preference for other protein sources. As a result, our 2026 forecast anticipates modest growth, with total sales up 1.4 per cent and volumes down 1.1 per cent.
Ingredient insights: Fish, shellfish and other fishery products
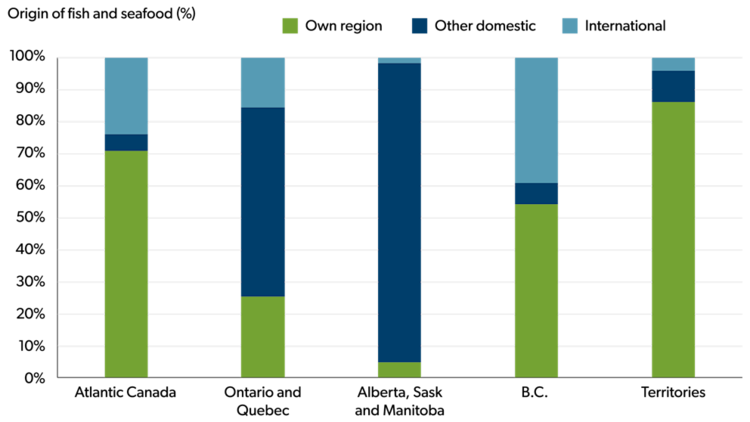
For seafood processors, nearly 60 per cent of the sector’s costs come directly from fish, crustaceans, shellfish and other fishery products. Most of these products are sourced from within Canada, with products moving from areas of high supply like Atlantic Canada and B.C. to areas with low supply through internal trade (Figure 7.2).
Figure 7.2: Most unprocessed fish and seafood products are sourced from Canada

Sources: Statistics Canada, FCC Economics
Processors’ reliance on these species means their fortunes rise and fall with the health of the ocean. Scaling production is heavily dependent on water conditions and government regulations. This is because total allowable catch (TAC) decisions, licensing rules, and quota systems shape the volume and timing of raw materials flowing into plants. Shifts in ocean temperatures and conditions, and stock changes can move prices quickly from one season to another, making business planning challenging.
Pricing of inputs is equally complex. While supply and demand remain the foundation, several provinces use formal negotiation structures to set agreements on prices between harvesters and processors. Newfoundland and Labrador’s Standing Fish Price Setting Panel is one example, acting as an arbitrator to set minimum prices each season. Other provinces rely on different agreements. Processors must continue to monitor TAC decisions, stock conditions and regional pricing agreements as they become available in 2026.
Seafood-preparation margins: 2026 forecast
Seafood processing in Canada remains regionally concentrated. Although the sector accounts for only 3.2 per cent of national food and beverage manufacturing sales, it is an economic anchor in coastal regions. In Atlantic Canada, seafood processing represents 59.1 per cent of all food and beverage processing sales, and roughly half of the region’s food and beverage processing workforce. In these communities, the fluctuations in margins don’t just impact the businesses but also the health of the communities.
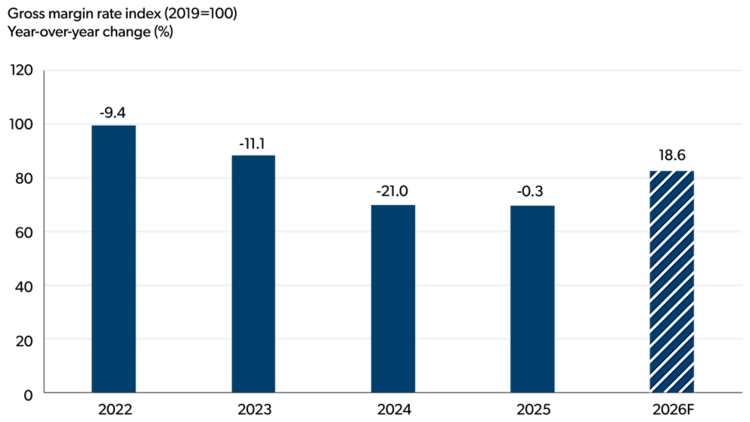
Following the decrease in 2025, margins are expected to strengthen in 2026 (Figure 7.3). We forecast an 18.6 per cent increase in gross margins, driven largely by easing input costs after the highs of 2024. Sales are expected to stay relatively stable, meaning the improvement comes almost entirely from more favourable cost conditions.
Figure 7.3: Seafood-preparation margins up again in 2026

Sources: FCC Economics, Statistics Canada
However, there are downside risks to these margins because of the uncertainty in international markets and the high dependency on exports to drive sales. The wildcard is how quickly trade opens back up with China following reduced tariff rates and access to the U.S. market. As always, weather will continue to influence stock conditions and TAC decisions. Overall, the sector enters 2026 in an improved position, but one still vulnerable to climate and trade.
Other trends to monitor in 2026
- The U.S. Executive Order to strengthen domestic harvesting and processing titled Restoring American Seafood Competitiveness could gradually erode Canada’s competitive position for exports.
- Canadian demand for seafood continues to depend on how its price and appeal compare with other proteins. Although seafood prices rose more slowly than beef and pork in 2025, fish and seafood remain secondary choices for many consumers, limiting domestic demand growth.
- The federal plan to phase out open‑net salmon aquaculture in B.C. by June 30, 2029, is already creating investment uncertainty, with industry warning of potential closures and downstream impacts on regional processing capacity.
- China’s reduced tariff on seafood products extends only until the end of 2026. Expect another announcement before end of 2026.
China’s tariff on fish and seafood exports in 2025
Just as Canada’s fish and seafood sector was gearing up for its busiest export months, China introduced a 25 per cent tariff on Canadian fish and seafood products on March 20, 2025. The tariff hit quickly. For some species, such as live lobsters and crabs, exports to China dropped sharply. Yet the story of 2025 isn’t just about loss, but also the sector’s resilience.
Going into 2025, several products were already known to be especially vulnerable to any disruption in trade with China (Table 7.1). These are species where China accounted for a large share of exports or where the product itself made up a meaningful portion of Canada’s overall seafood trade. Live lobsters sat at the top of this list, an anchor export worth roughly $1.2 billion in 2024. The challenge is that nearly 40 per cent of those shipments went to China.
Table 7.1: Value impact of China’s tariffs on Canadian fish and seafood exports
| Fish and seafood products by vulnerability* to Chinese market | 2024-2025 Change in export values to China (per cent) | 2024-2025 Change in export values to world (per cent) |
|---|---|---|
| Live lobsters | -39.0 | -5.4 |
| Cold water shrimps and prawns, frozen | -8.2 | 1.1 |
| Live crabs | -30.6 | -19.7 |
| Frozen crabs | -56.6 | 27.6 |
| Frozen clams, cockles and ark shells | -10.8 | -6.7 |
* Vulnerability ranking calculated as the export share to the world of each product multiplied by the export share to China in 2024.
Sources: FCC Economics and Canadian International Merchandise Trade Database
Frozen crab, for example, saw purchases from China fall by 56.6 per cent, but the industry managed to redirect product to other buyers, resulting in a 27.6 per cent increase in total export value.
The U.S. absorbed the bulk of this shift, while Vietnam, France and Great Britain also imported more.
Live lobster exporters had a tougher path. Exports to China fell 39 per cent in 2025, reflecting how heavily this product depends on two key markets: the U.S. and China. Even with some short lived benefits from China’s tariff spike on U.S. lobster earlier in the year, the drop in exports underscores just how exposed the industry is to political and trade tensions beyond its control. With China and the U.S. together accounting for nearly all of Canada’s live lobster exports, any future change in market access or tariff policy could again create significant turbulence.
Overall, the fish and seafood sector felt the impact of China’s tariffs on exports in 2025 but also showed its resilience. As the 2026 season begins with lower tariff barriers, exporters can refocus on market development, diversification and navigating the ever present forces of nature that shape each year’s harvest.


